Images
Vidéos
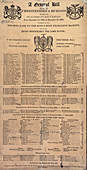
12904175 - Bills of mortality for 1821-1822 listing the causes of death

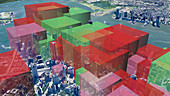
13622192 - Medical financial analysis, conceptual image

13622191 - Medical financial analysis, conceptual image

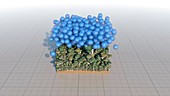
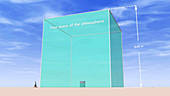
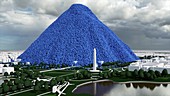
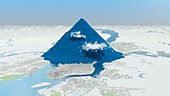
12948829 - One metric ton of CO2 gas, illustration
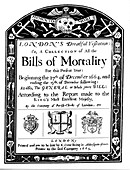
12916373 - Bills of mortality bill for London
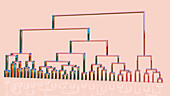
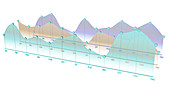
13636226 - Dendogram, illustration

13636224 - Dendogram, illustration

13622193 - Medical financial analysis, conceptual image

13351596 - Close up POV runner using health app
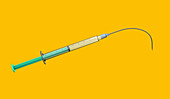
13480342 - Injection needle bending downwards, illustration
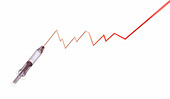
13480341 - Injection needle forming line graph, illustration
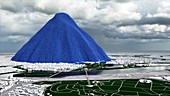
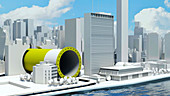
12948830 - 300 tonnes of CO2 gas in hectare of rainforest, illustration
12360791 - Daily CO2 emissions by the USA

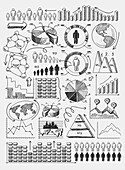
12402024 - Graph and chart icons, illustration

12396467 - Abstract circular display element, illustration

12401185 - Graph and chart icons, illustration

12399975 - Graph and chart icons, illustration

12360792 - Daily CO2 emissions by the USA
13463965 - Financial analysis, conceptual illustration

12420343 - Gregor Mendel's early life as a monk, 1840s
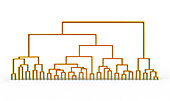
13636223 - Dendogram, illustration

13348269 - POV Man checking health statistics on smart phone
12399974 - Graph and chart icons, illustration

13839520 - Machine learning, conceptual illustration

13636222 - Dendogram, illustration

13636221 - Dendogram, illustration

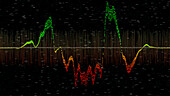
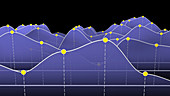
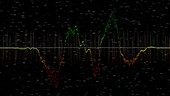
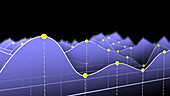
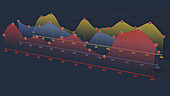
12975295 - Line graphs, illustration

12399186 - Science icons, illustration
11720219 - Per capita share of atmosphere and CO2

12402021 - Graph and chart icons, illustration
11720205 - Global rate of natural gas consumption
12975300 - Line graphs, illustration

12975297 - Line graphs, illustration

12975294 - Line graphs, illustration
12975291 - Annual report, illustration
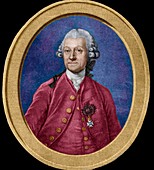
12447317 - Pehr Wargentin

13622190 - Medical financial analysis, conceptual image

12396459 - Abstract circular display element, illustration

11730204 - Cholera epidemic research,1855

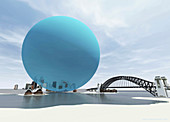
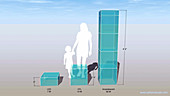
11720223 - One metric ton of CO2 gas
11720222 - Australia's daily CO2 emission

13636225 - Dendogram, illustration
12955591 - Financial data, conceptual illustration
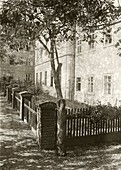
12420344 - Gregor Mendel's research garden at St Thomas' Abbey

12360790 - Daily CO2 emissions by the USA

12398790 - Cogs and gears, illustration

13480340 - Injection needle forming line graph, illustration

12975302 - Line graphs, illustration

12959187 - Scissors cutting a rising line graph, illustration

12397155 - Illustration of businessmen calculating stock finances

12959189 - Scissors cutting a rising line graph, illustration

11720224 - Daily global CO2 emissions

12975301 - Line graphs, illustration

13250307 - Machine learning, conceptual illustration

12399988 - Graph and chart icons, illustration
11720218 - Light bulb daily CO2 emissions
12975303 - Line graphs, illustration
12975299 - Line graphs, illustration

11720537 - Daily global CO2 emissions

12972009 - Dice and waves, illustration

11720216 - Australia's daily per-capita CO2 emission

11707418 - Early demography research,1662

12399747 - Business icons, illustration
11730203 - Cholera epidemic research,1855
12360793 - Hourly CO2 emissions by the USA

11720204 - Global rate of oil consumption
12399748 - Graph and chart icons, illustration

11720206 - One day of global coal consumption

11697146 - Diabetes prediction,conceptual image

12975292 - Line graphs, illustration
12975290 - Annual report, illustration

12959188 - Scissors cutting a rising line graph, illustration

12399976 - Graph and chart icons, illustration

12399185 - Science icons, illustration

13480343 - Injection needle forming line diagram, illustration

12399977 - Graph and chart icons, illustration

12399750 - Business icons, illustration

12449835 - Abstract circular display element
11720538 - Daily global CO2 emissions
11720207 - New York City particulate air pollution
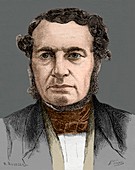
11644608 - Joseph-Francois Malgaigne

11720215 - Daily per-capita water consumption

12659061 - Dice and waves, illustration

12975293 - Line graphs, illustration
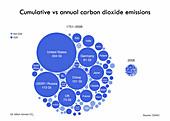
11720221 - Cumulative and annual CO2 emissions
11720209 - New York City particulate air pollution
11720208 - New York City particulate air pollution

12975296 - Line graphs, illustration

12975298 - Line graphs, illustration
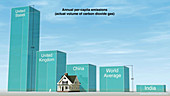
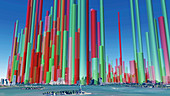
11720217 - Annual per-capita CO2 emissions
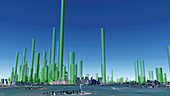
11720220 - Global volume of man-made CO2

11720225 - Global CO2 emission rate
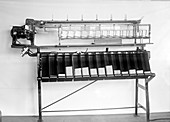
11618217 - Tabulating machines,early 20th century
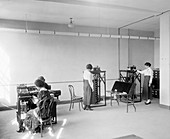
11618215 - Tabulating machine,1919

11688221 - Sir David Cox,British statistician

11887221 - Random universe

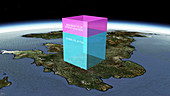
11562848 - Overpopulation of the UK and Ireland

11844605 - Road traffic accident death
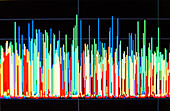
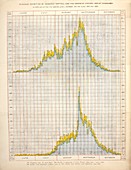
11896344 - Histogram
page suivante
Statistique Photos ❘ Science Photo Library