June 2019 monthly global temperature difference map
Numéro d’image : 12949166
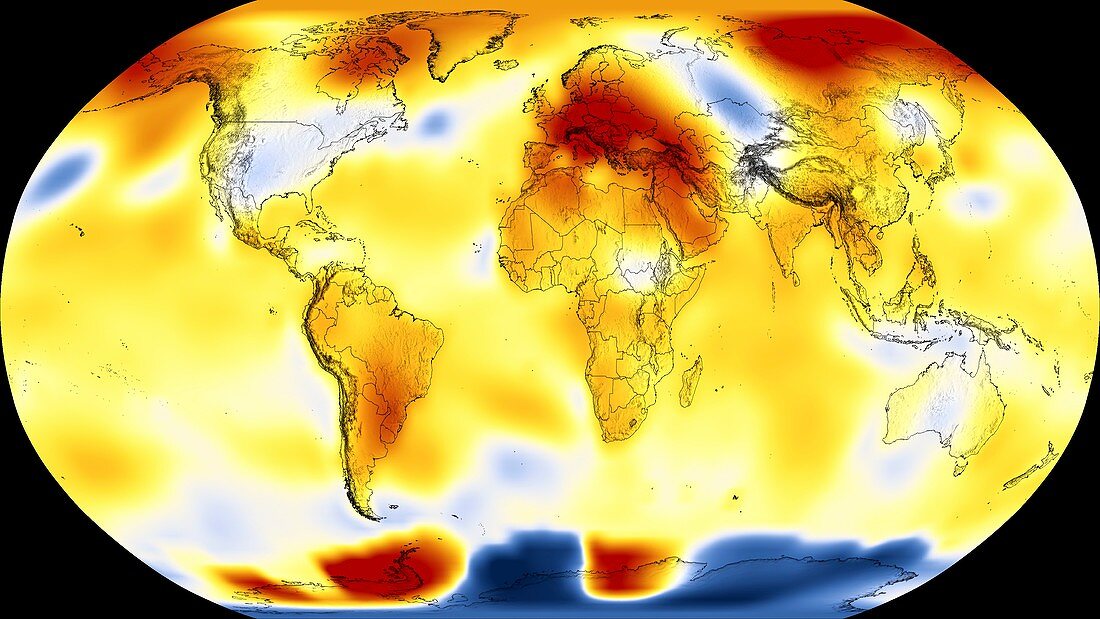
| June 2019 monthly global temperature difference map. The temperature difference the current temperature and a historical average is colour-coded: blue for cooler temperatures and yellow to orange and red for hotter temperatures. The historical average used is the 30-year period from 1951 to 1980. June 2019 was the hottest June in the 140-year temperature record. Nine of the 10 hottest Junes have occurred since 2010. This is part of the evidence for climate change and global warming. This images uses the NASA Goddard Institute for Space Studies (GISS) Surface Temperature Analysis dataset (GISTEMP). | |
| Licence : | Droits gérés |
| Crédit: | Science Photo Library / NASA's Goddard Space Flight Center |
| Taille de l’image : | 5580 px × 3139 px |
| Model Release : | Non requis |
| Property Release : | Non requis |
| Restrictions : | - |
Prix pour cette image À partir de 45 €
Produit vendu
(Calendrier, Carte postale, Carte de vœux, Impression sur textile, Packaging etc)
À partir de 45 €
Usage commercial
(Affichage, Annonce presse, Annonce TV, Carte, Digital - hors rés. sociaux, Digital - rés. sociaux etc)
À partir de 45 €
Éditorial
(Digital, Journal, Livre, Livre pratique, Magazine, Télévision etc)
À partir de 60 €
Usage non-commercial
(Digital - hors rés. sociaux, Digital - rés. sociaux etc)
À partir de 120 €
Mots clés
- 2019,
- 21ème siècle,
- aucun,
- battre un record,
- carte,
- changement climatique,
- climatologie,
- climatologique,
- dans le monde entier,
- différences de température,
- disques,
- dossiers,
- entier,
- été,
- géographie,
- géographique,
- global,
- GODDARD,
- juin,
- modèle,
- mondial,
- observation de la terre,
- personne,
- planétaire,
- plus chaud,
- plus froid,
- réchauffement climatique,
- record,
- régistres,
- terre,
- XX1ème siècle