Gravity map of Earth
Numéro d’image : 11667522
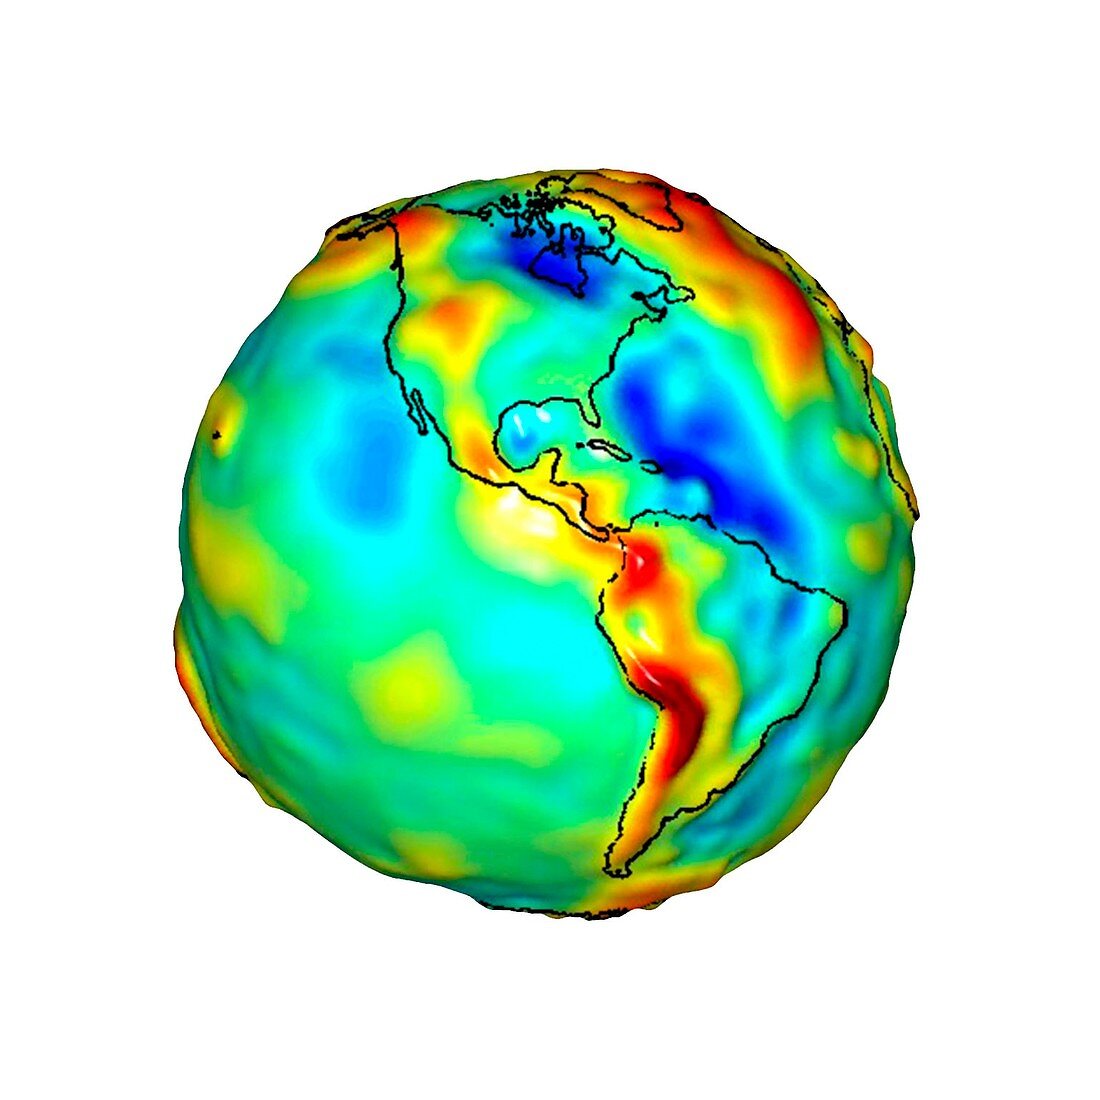
| Gravity map of Earth. Computer model showing the variation of the Earth's gravity field centred on the Americas. Colours represent gravity anomaly. These are the differences between the theoretical value for the gravity at the surface,if the Earth was a perfectly smooth ellipsoid,and the actual measured value. They range from blue (low gravity),through green,yellow,orange and red (high gravity). This model was created from data acquired by NASA's Gravity Recovery and Climate Experiment (GRACE). An accurate gravity map enables scientists to better understand the Earth's internal structure and may help predict climate change and natural hazards | |
| Licence : | Droits gérés |
| Crédit: | Science Photo Library / University of Texas Center for Space Research / JPL / NASA |
| Taille de l’image : | 2965 px × 2965 px |
| Model Release : | Non requis |
| Property Release : | Non requis |
| Restrictions : | - |
Prix pour cette image À partir de 45 €
Produit vendu
(Calendrier, Carte postale, Carte de vœux, Impression sur textile, Packaging etc)
À partir de 45 €
Usage commercial
(Affichage, Annonce presse, Annonce TV, Carte, Digital - hors rés. sociaux, Digital - rés. sociaux etc)
À partir de 45 €
Éditorial
(Digital, Journal, Livre, Livre pratique, Magazine, Télévision etc)
À partir de 60 €
Usage non-commercial
(Digital - hors rés. sociaux, Digital - rés. sociaux etc)
À partir de 120 €
Mots clés
- Amérique du Nord,
- Amérique du Sud,
- Amérique Latine,
- Amériques,
- arrière plan blanc,
- arrière-plan blanc,
- astrophysique,
- astrophysiques,
- carte gravité,
- coupé,
- coupe-circuit,
- découpé,
- découpes,
- détourages,
- détouré,
- disjoncteur,
- entier,
- fond blanc,
- global,
- globe,
- GRACE,
- gravité,
- masse,
- nord américain,
- nord-américain,
- observation de la terre,
- planète,
- silhouette,
- terre