Cold snap in January 2010,world map
Numéro d’image : 11575451
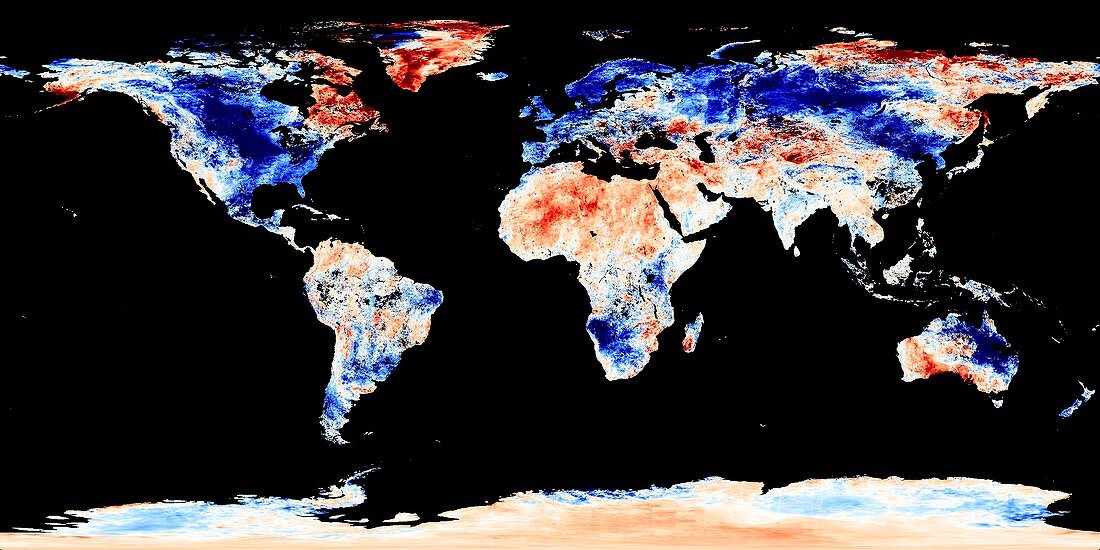
| Cold snap in January 2010,world map. Land surface temperature anomaly global satellite map for the period from 1 to 8 January 2010. The colours indicate temperature change from the average for this time of year during the period 2000 to 2008. Blue indicates a decrease in temperature of 12 degrees Celsius,while red indicates an increase of 12 degrees Celsius. Lighter shades of blue and red indicate less change,with white showing no change. The data for this image are from the Moderate Resolution Imaging Spectroradiometer (MODIS) on NASA’s Terra satellite | |
| Licence : | Droits gérés |
| Crédit: | Science Photo Library / MODIS LAND GROUP / JESSE ALLEN, EARTH OBSERVATORY / NASA |
| Taille de l’image : | 5929 px × 2965 px |
| Model Release : | Non requis |
| Property Release : | Non requis |
| Restrictions : | - |
Prix pour cette image À partir de 45 €
Produit vendu
(Calendrier, Carte postale, Carte de vœux, Impression sur textile, Packaging etc)
À partir de 45 €
Usage commercial
(Affichage, Annonce presse, Annonce TV, Carte, Digital - hors rés. sociaux, Digital - rés. sociaux etc)
À partir de 45 €
Éditorial
(Digital, Journal, Livre, Livre pratique, Magazine, Télévision etc)
À partir de 60 €
Usage non-commercial
(Digital - hors rés. sociaux, Digital - rés. sociaux etc)
À partir de 120 €
Mots clés
- 2010,
- 21ème siècle,
- carte,
- changement climatique,
- conditions extrêmes,
- congelé,
- coup de froid,
- dans le monde entier,
- de l'espace,
- entier,
- froid,
- gelé,
- global,
- hiver,
- hivernal,
- image satellite,
- janvier,
- météo extrême,
- météorologie,
- météorologique,
- modis,
- mondial,
- observation de la terre,
- planétaire,
- planète,
- réchauffement climatique,
- satellite,
- science de la terre,
- surgelé,
- temps extrême,
- tendance,
- terra,
- terre,
- XX1ème siècle