Genetic influences on brain structure, illustration
Numéro d’image : 13951563
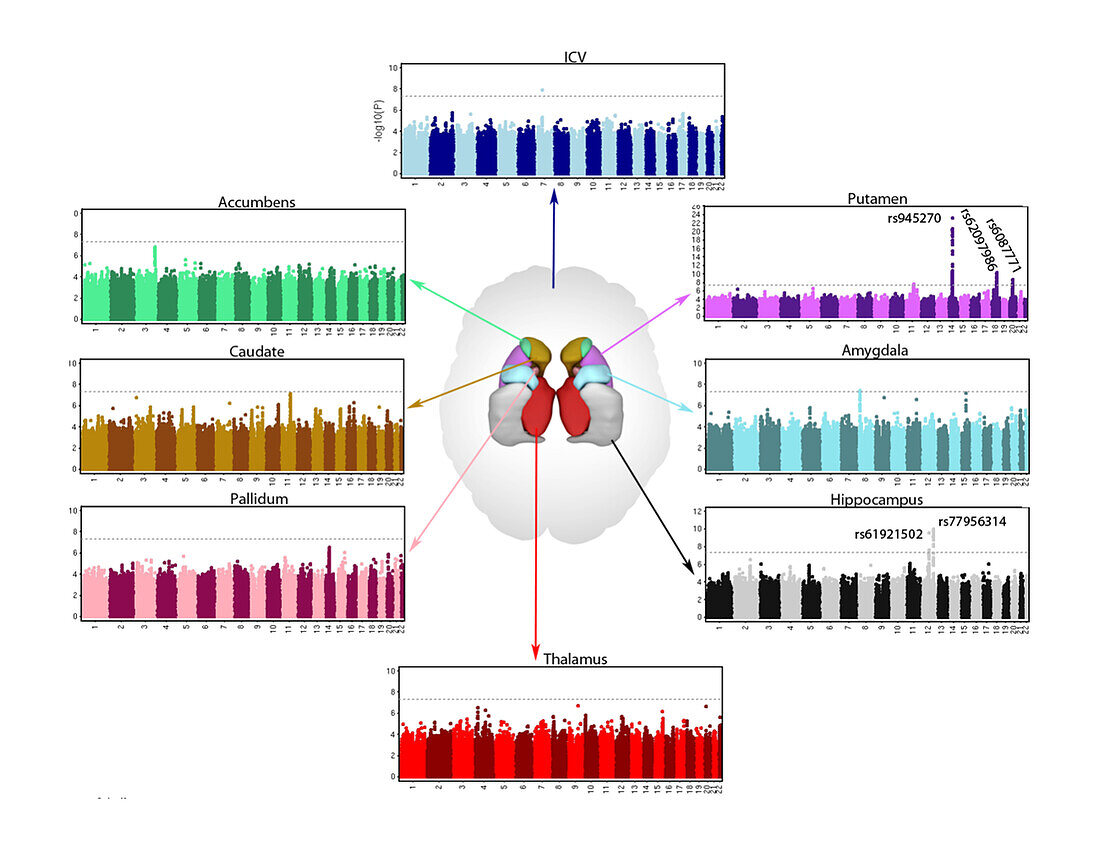
| Charts showing genetic influences on brain structure. The charts are colour-coded to their respective brain structures shown at centre. The charts show the positions of genes (x-axis) and the evidence for association (y-axis) for each common genetic variant that influences brain volume. | |
| Licence : | Droits gérés |
| Crédit: | Science Photo Library / MARK AND MARY STEVENS NEUROIMAGING AND INFORMATICS INSTITUTE |
| Taille de l’image : | 4770 px × 3669 px |
| Model Release : | Non requis |
| Property Release : | Non requis |
| Restrictions : | - |
Prix pour cette image À partir de 45 €
Produit vendu
(Calendrier, Carte postale, Carte de vœux, Impression sur textile, Packaging etc)
À partir de 45 €
Usage commercial
(Affichage, Annonce presse, Annonce TV, Carte, Digital - hors rés. sociaux, Digital - rés. sociaux etc)
À partir de 45 €
Éditorial
(Digital, Journal, Livre, Livre pratique, Magazine, Télévision etc)
À partir de 60 €
Usage non-commercial
(Digital - hors rés. sociaux, Digital - rés. sociaux etc)
À partir de 120 €