Global map showing particulate-related mortality
Numéro d’image : 13613639
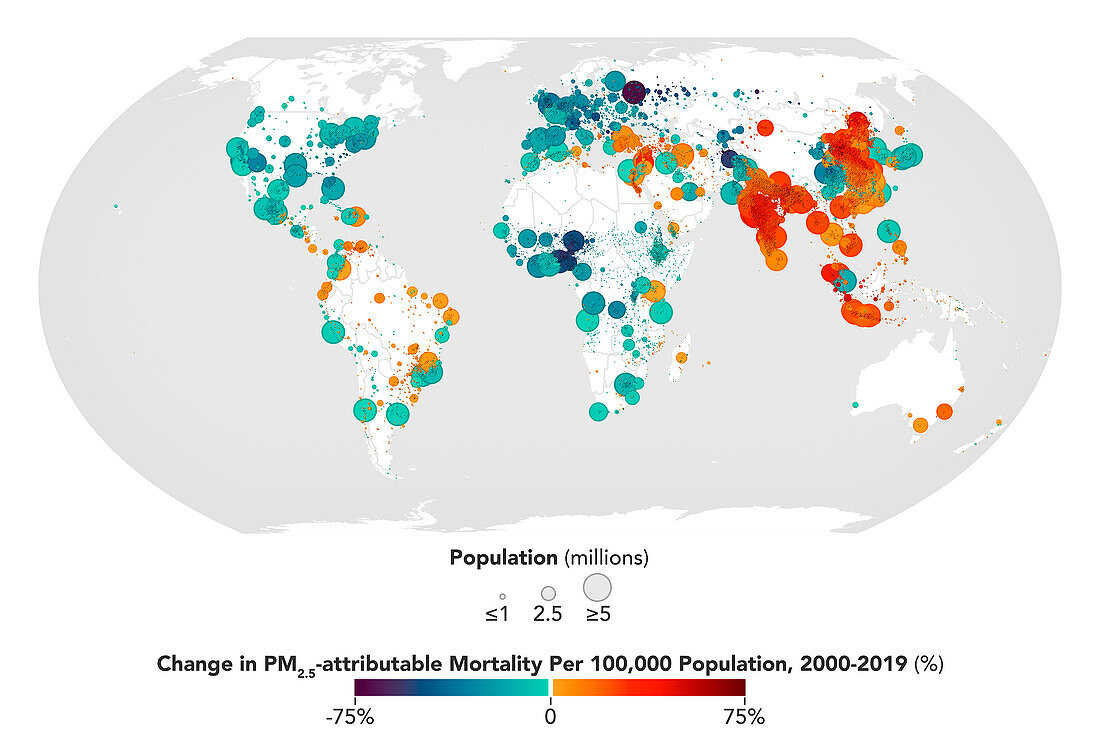
| Global map showing changes in fine particulate matter (PM2.5) attributable mortality per 100, 000 of the population from 2000-2019. Darker purple areas show a 75 percent decline in fine particulate matter attributable mortality whilst red areas show a 75 percent increase in fine particulate matter attributable mortality during this period. Fine particulate matter causes respiratory diseases, cardiovascular problems and premature death. Data obtained from two decades of NASA satellite data and health data from the Global Burden of Disease study by Institute for Health Metrics and Evaluation. | |
| Licence : | Droits gérés |
| Crédit: | Science Photo Library / NASA |
| Taille de l’image : | 7200 px × 4800 px |
| Model Release : | Non requis |
| Property Release : | Non requis |
| Restrictions : | - |
Prix pour cette image À partir de 45 €
Produit vendu
(Calendrier, Carte postale, Carte de vœux, Impression sur textile, Packaging etc)
À partir de 45 €
Usage commercial
(Affichage, Annonce presse, Annonce TV, Carte, Digital - hors rés. sociaux, Digital - rés. sociaux etc)
À partir de 45 €
Éditorial
(Digital, Journal, Livre, Livre pratique, Magazine, Télévision etc)
À partir de 60 €
Usage non-commercial
(Digital - hors rés. sociaux, Digital - rés. sociaux etc)
À partir de 120 €