Normal ECG wave in lead V1, illustration
Numéro d’image : 13453411
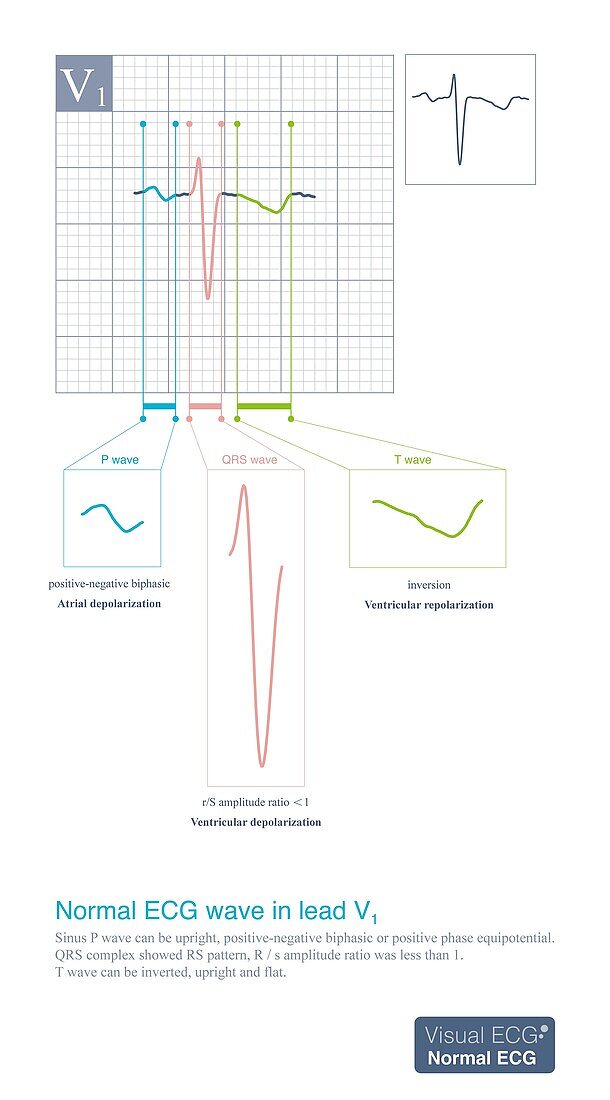
| Electrocardiogram (ECG) illustration showing a normal wave in lead V1. Under normal circumstances the sinus P wave in lead V1 can be positive and negative biphasic, the QRS complex is dominated by the S wave, and the T wave can be inverted. | |
| Licence : | Droits gérés |
| Crédit: | Science Photo Library / CHONGQING TUMI TECHNOLOGY LTD |
| Taille de l’image : | 2800 px × 5048 px |
| Model Release : | Non requis |
| Property Release : | Non requis |
| Restrictions : | - |
Prix pour cette image À partir de 45 €
Produit vendu
(Calendrier, Carte postale, Carte de vœux, Impression sur textile, Packaging etc)
À partir de 45 €
Usage commercial
(Affichage, Annonce presse, Annonce TV, Carte, Digital - hors rés. sociaux, Digital - rés. sociaux etc)
À partir de 45 €
Éditorial
(Digital, Journal, Livre, Livre pratique, Magazine, Télévision etc)
À partir de 60 €
Usage non-commercial
(Digital - hors rés. sociaux, Digital - rés. sociaux etc)
À partir de 120 €