QT interval comparison, illustration
Numéro d’image : 13453389
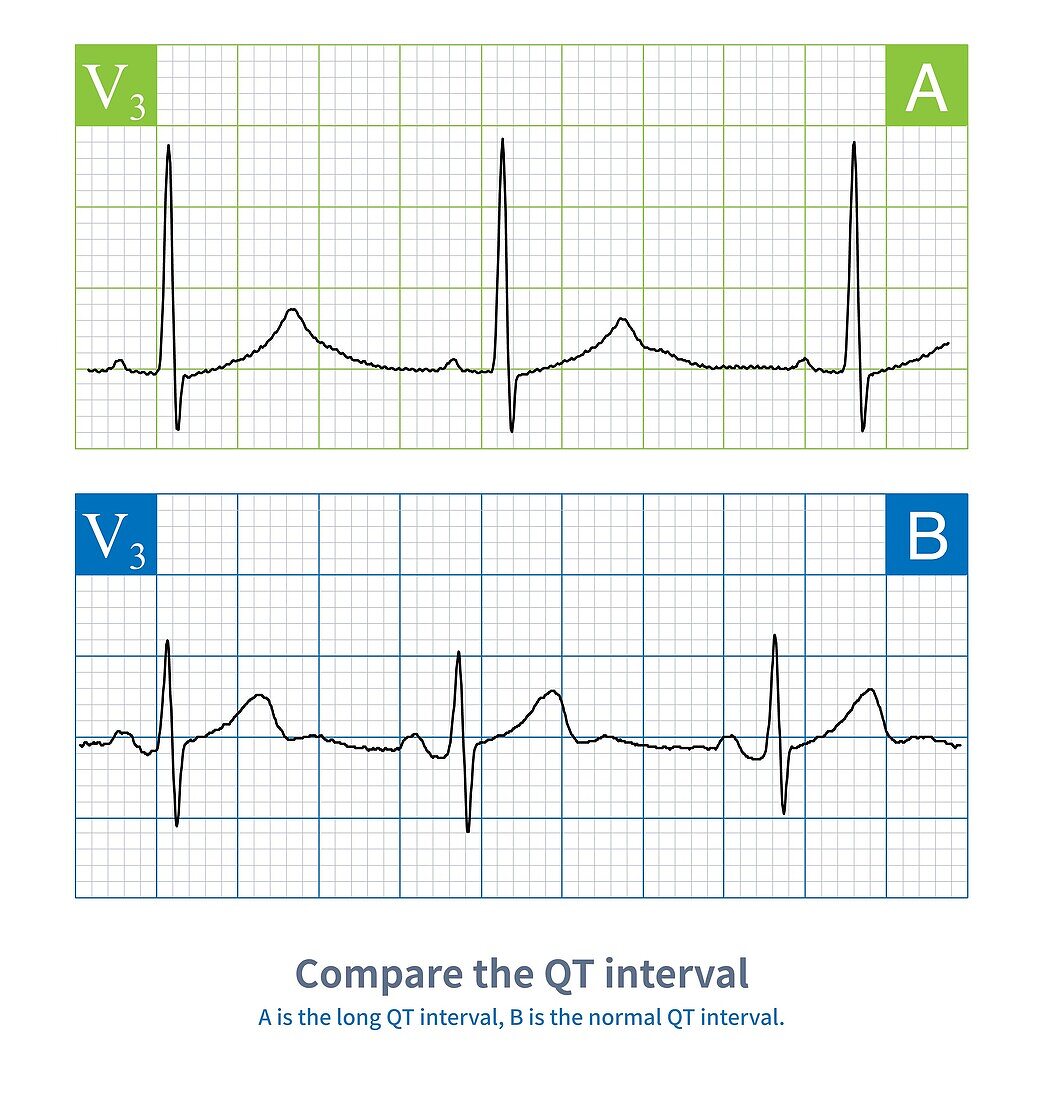
| Electrocardiogram (ECG) illustration showing a long QT interval (top) and a normal QT interval (bottom). | |
| Licence : | Droits gérés |
| Crédit: | Science Photo Library / CHONGQING TUMI TECHNOLOGY LTD |
| Taille de l’image : | 2674 px × 2821 px |
| Model Release : | Non requis |
| Property Release : | Non requis |
| Restrictions : | - |
Prix pour cette image À partir de 45 €
Produit vendu
(Calendrier, Carte postale, Carte de vœux, Impression sur textile, Packaging etc)
À partir de 45 €
Usage commercial
(Affichage, Annonce presse, Annonce TV, Carte, Digital - hors rés. sociaux, Digital - rés. sociaux etc)
À partir de 45 €
Éditorial
(Digital, Journal, Livre, Livre pratique, Magazine, Télévision etc)
À partir de 60 €
Usage non-commercial
(Digital - hors rés. sociaux, Digital - rés. sociaux etc)
À partir de 120 €