World population density, 2016
Numéro d’image : 13355615
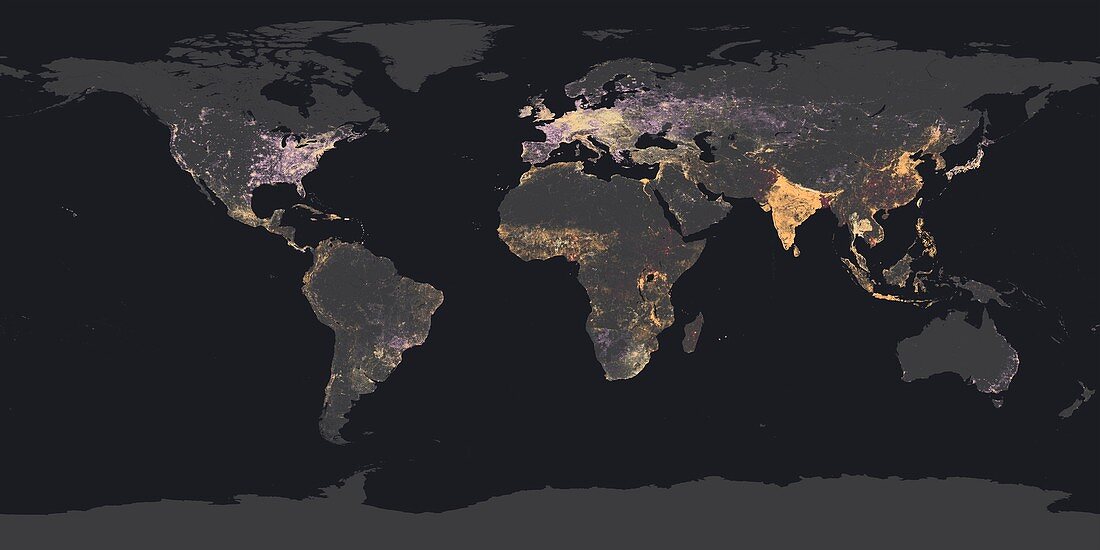
| Colour-coded map showing the variation in population density around the world in 2016. Rural areas, with upto 100 people per square kilometre (km), are light purple. Settled areas, with up to 400 per square km. are dark purple. Urban areas. with up to 1, 908 people per square km. are brown. Heavy urban areas. with up to 16, 978 people per square km. are orange. Extreme urban areas. with up to 26, 331 people per square km. are red. | |
| Licence : | Droits gérés |
| Crédit: | Science Photo Library / NOAA |
| Taille de l’image : | 4200 px × 2100 px |
| Model Release : | Non requis |
| Property Release : | Non requis |
| Restrictions : |
|
Prix pour cette image À partir de 45 €
Produit vendu
(Calendrier, Carte postale, Carte de vœux, Impression sur textile, Packaging etc)
À partir de 45 €
Usage commercial
(Affichage, Annonce presse, Annonce TV, Carte, Digital - hors rés. sociaux, Digital - rés. sociaux etc)
À partir de 45 €
Éditorial
(Digital, Journal, Livre, Livre pratique, Magazine, Télévision etc)
À partir de 60 €
Usage non-commercial
(Digital - hors rés. sociaux, Digital - rés. sociaux etc)
À partir de 120 €