1950s house, thermogram
Numéro d’image : 12527001
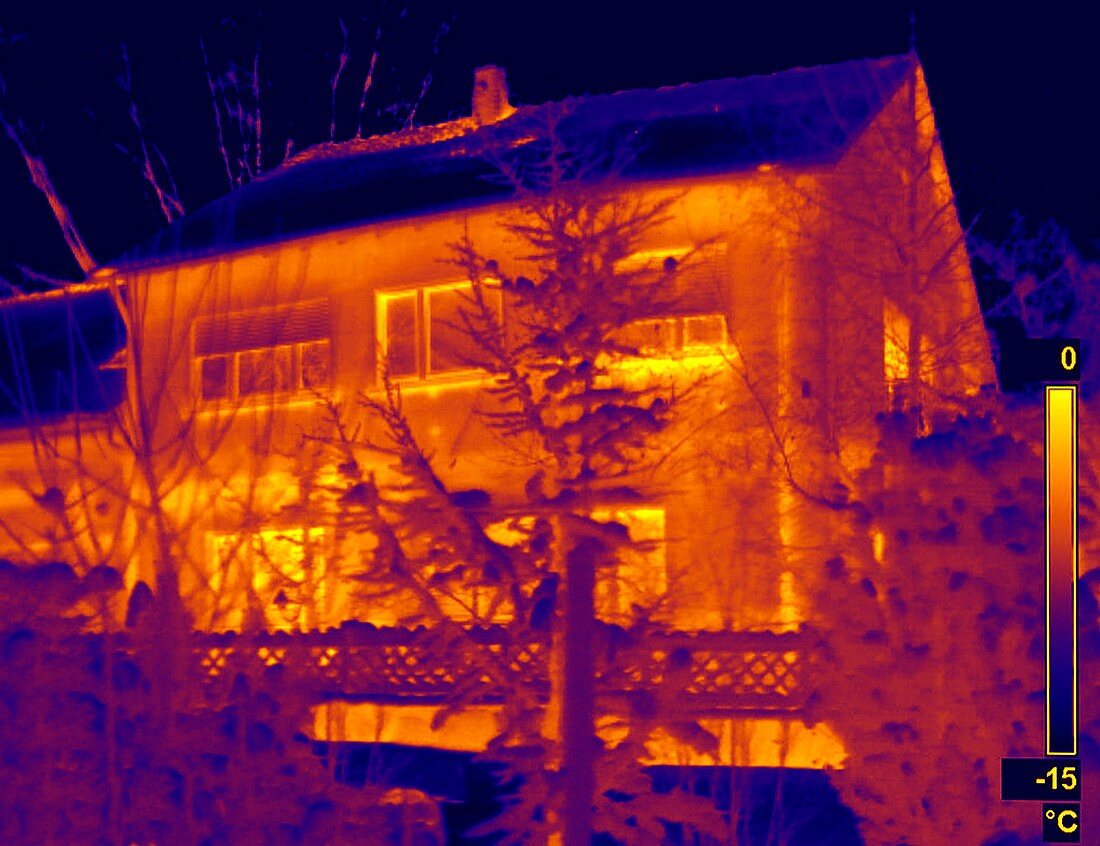
| 1950s house, thermogram. A thermogram shows the variation in temperature on the surface of an object, measured by the long-wave infrared radiation it emits. The temperature scale is colour-coded and runs from black (coldest) through blue, purple and orange to yellow (warmest). This imaging technique can be used to check the energy efficiency of buildings. The areas that appear hotter in a building thermogram are where heat is being lost. | |
| Licence : | Droits gérés |
| Crédit: | Science Photo Library / EYE OF SCIENCE |
| Taille de l’image : | 3370 px × 2593 px |
| Model Release : | Non requis |
| Property Release : | Non requis |
| Restrictions : |
|
Prix pour cette image À partir de 45 €
Produit vendu
(Calendrier, Carte postale, Carte de vœux, Impression sur textile, Packaging etc)
À partir de 45 €
Usage commercial
(Affichage, Annonce presse, Annonce TV, Carte, Digital - hors rés. sociaux, Digital - rés. sociaux etc)
À partir de 45 €
Éditorial
(Digital, Journal, Livre, Livre pratique, Magazine, Télévision etc)
À partir de 60 €
Usage non-commercial
(Digital - hors rés. sociaux, Digital - rés. sociaux etc)
À partir de 120 €
Mots clés
- 1950,
- architecture,
- bâtiment,
- bâtiments,
- caméra infrarouge,
- chaleur,
- chaud,
- coloré,
- colorié,
- colorisé,
- conception,
- décès,
- design,
- domestique,
- efficacité,
- empreinte carbone,
- immeubles,
- inefficace,
- infrarouge,
- IR,
- logement,
- maison,
- perte,
- résidentiel,
- sciences de l'environnement,
- sciences environnementales,
- technologie,
- technologie de la construction,
- technologique,
- thermique,
- thermogramme,
- thermographie,
- vieux