Warming Coffee Machine
Numéro d’image : 12066168
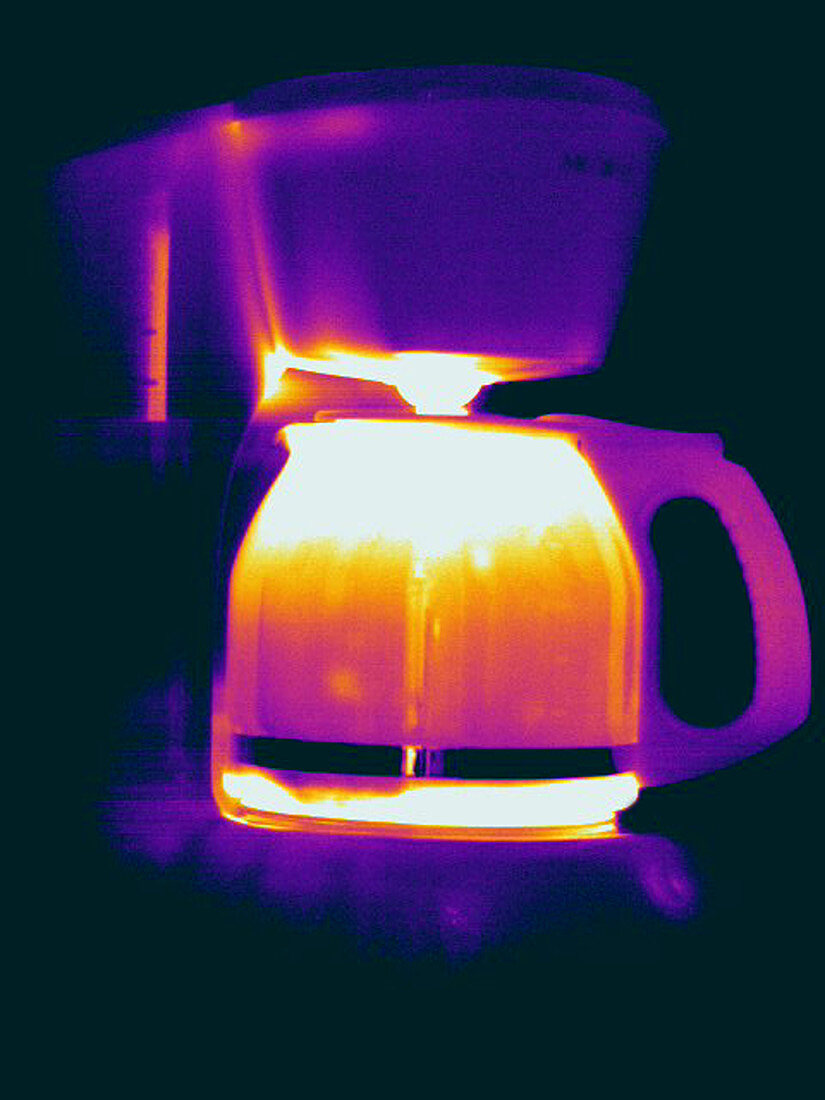
| A Thermogram of a coffee machine as it warms up. The different colours represent different temperatures. The lightest colours are the hottest temperatures,while the darker colours represent cooler temperatures. Thermography uses special cameras that can detect light in the far-infrared range of the electromagnetic spectrum (900Â14,000 nanometers or 0.9Â14 µm) to create an image that represents an objects temperature. This is one image from a series that shows the coffee pot getting hotter | |
| Licence : | Droits gérés |
| Crédit: | Science Photo Library / Kinsman, Edward |
| Taille de l’image : | 2700 px × 3600 px |
| Model Release : | Non requis |
| Property Release : | Non requis |
| Restrictions : |
|
Prix pour cette image À partir de 45 €
Produit vendu
(Calendrier, Carte postale, Carte de vœux, Impression sur textile, Packaging etc)
À partir de 45 €
Usage commercial
(Affichage, Annonce presse, Annonce TV, Carte, Digital - hors rés. sociaux, Digital - rés. sociaux etc)
À partir de 45 €
Éditorial
(Digital, Journal, Livre, Livre pratique, Magazine, Télévision etc)
À partir de 60 €
Usage non-commercial
(Digital - hors rés. sociaux, Digital - rés. sociaux etc)
À partir de 120 €
Mots clés
- article commun,
- articles,
- café,
- cafetière,
- chaleur,
- chaud,
- éléments,
- froid,
- infrarouge,
- irradier,
- objet familier,
- objets,
- pot café,
- pot de café,
- radiation thermique,
- rayonnement,
- rayonnement infrarouge,
- rayonnement thermique,
- rayonner,
- rayons infrarouges,
- spectre,
- spectre électromagnétique,
- spectrum,
- température,
- thermique,
- thermogramme,
- thermographe,
- thermographie,
- thermographique