Venn Diagram of Intersecting Circles
Numéro d’image : 12038571
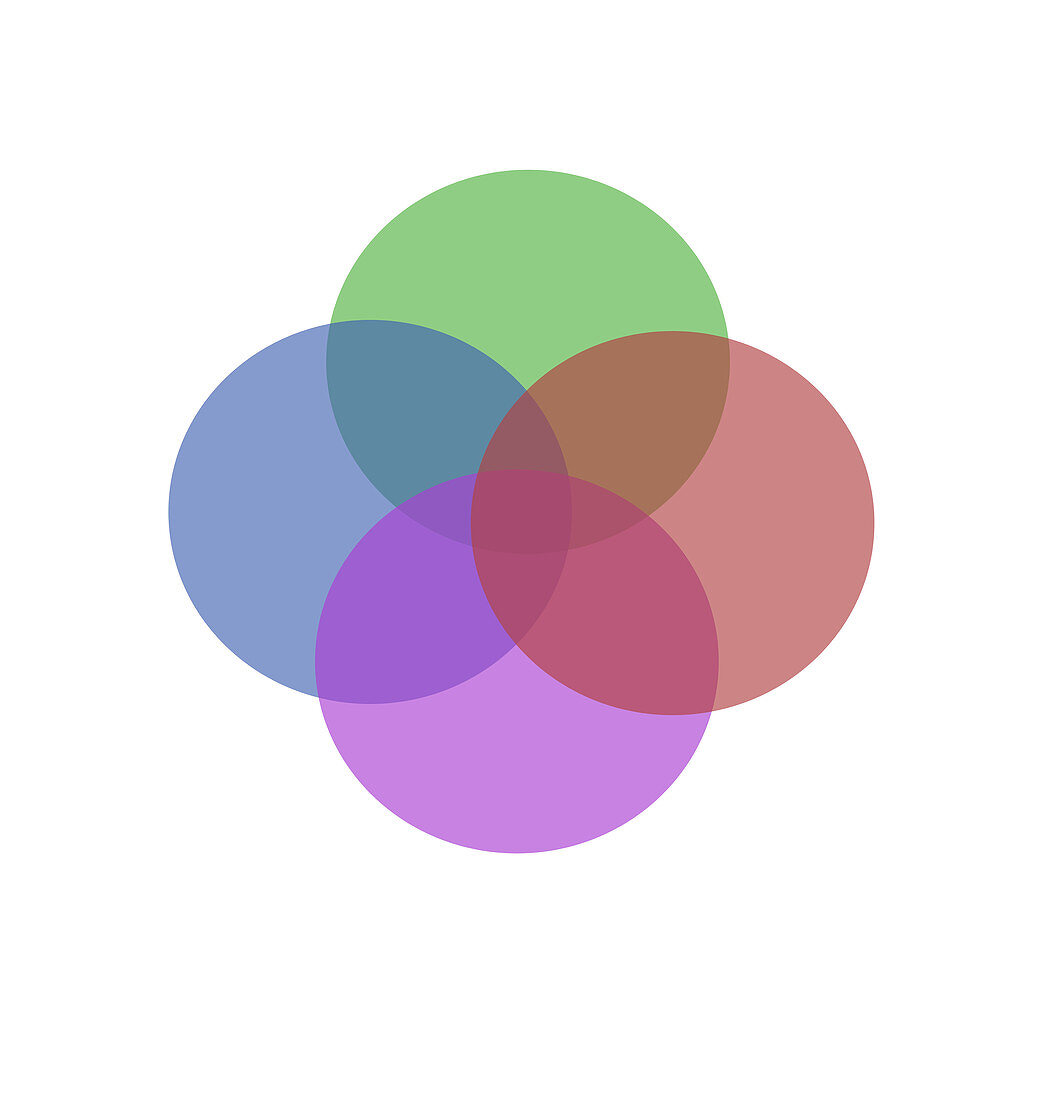
| Venn diagrams display the overlap of circles coloured in red,purple,green and blue. The venn diagram is named after the British logician John Venn (1834-1923). These diagrams are used in mathematical and scientific disciplines,such as set theory,probability theory,statistics and computer science | |
| Licence : | Droits gérés |
| Crédit: | Science Photo Library / Shockey, Gwen |
| Taille de l’image : | 3018 px × 3150 px |
| Model Release : | Non requis |
| Property Release : | Non requis |
| Restrictions : |
|
Prix pour cette image À partir de 45 €
Produit vendu
(Calendrier, Carte postale, Carte de vœux, Impression sur textile, Packaging etc)
À partir de 45 €
Usage commercial
(Affichage, Annonce presse, Annonce TV, Carte, Digital - hors rés. sociaux, Digital - rés. sociaux etc)
À partir de 45 €
Éditorial
(Digital, Journal, Livre, Livre pratique, Magazine, Télévision etc)
À partir de 60 €
Usage non-commercial
(Digital - hors rés. sociaux, Digital - rés. sociaux etc)
À partir de 120 €
Mots clés
- arrière plan blanc,
- arrière-plan blanc,
- carré,
- cercle,
- chevauchement,
- chevaucher,
- circulaire,
- couleur,
- couleurs,
- croisement,
- ensemble,
- fixer,
- fond blanc,
- illustration,
- intersection,
- logique,
- math,
- mathématique,
- mathématiques,
- maths,
- placer,
- probabilité,
- quartet,
- quatre,
- rond,
- schéma,
- science de l'informatique,
- set,
- statistiques,
- théorie des ensembles