Scientist with graph of atmospheric CO2 1958-1989
Numéro d’image : 12000398
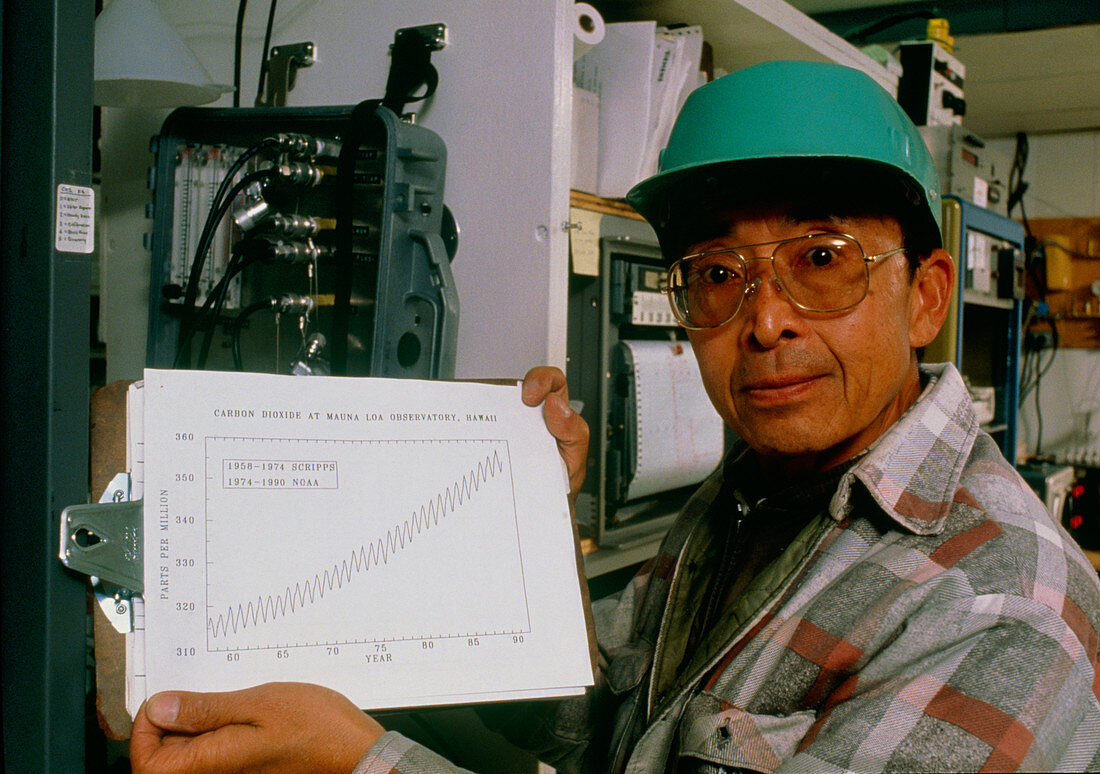
| Greenhouse Effect research. A climate physicist with a ''Keeling Curve'',a graph showing the concentration of atmospheric carbon dioxide (CO2) in the years 1958-1989 as measured at an altitude of 4170 meters on Mauna Loa,Hawaii. There are two main features to the graph. First,there is an obvious upward trend,the annual peak concentration rising from 318 parts per million (ppm) in 1958 to 356 ppm in 1989. There is also an annual variation of about 5ppm between spring (maximum) and autumn. The graph is named after Charles Keeling (b.1928),discoverer of the trend. CO2 is the main 'greenhouse gas',thought to be the cause of global warming | |
| Licence : | Droits gérés |
| Crédit: | Science Photo Library / Morgan, Hank |
| Taille de l’image : | 5034 px × 3543 px |
| Model Release : | Le droit n'est pas encore disponible. Merci de nous contacter avant utilisation. |
| Property Release : | Non requis |
| Restrictions : |
|
Prix pour cette image À partir de 45 €
Produit vendu
(Calendrier, Carte postale, Carte de vœux, Impression sur textile, Packaging etc)
À partir de 45 €
Usage commercial
(Affichage, Annonce presse, Annonce TV, Carte, Digital - hors rés. sociaux, Digital - rés. sociaux etc)
À partir de 45 €
Éditorial
(Digital, Journal, Livre, Livre pratique, Magazine, Télévision etc)
À partir de 60 €
Usage non-commercial
(Digital - hors rés. sociaux, Digital - rés. sociaux etc)
À partir de 120 €
Mots clés
- atmosphère,
- climatologie,
- climatologique,
- climatologiste,
- climatologue,
- CO2,
- dioxyde de carbone,
- effet de serre,
- gaz à effet de serre,
- géographie,
- graphique,
- homme,
- horizontal,
- masculin,
- part,
- participation,
- paysage,
- physicien,
- pollution,
- présenter,
- propriété,
- réchauffement climatique,
- recherche,
- sciences de l'environnement,
- sciences environnementales,
- scientifique,
- tenant,
- tenir