Scientist with NMR spectrometer & display
Numéro d’image : 11901833
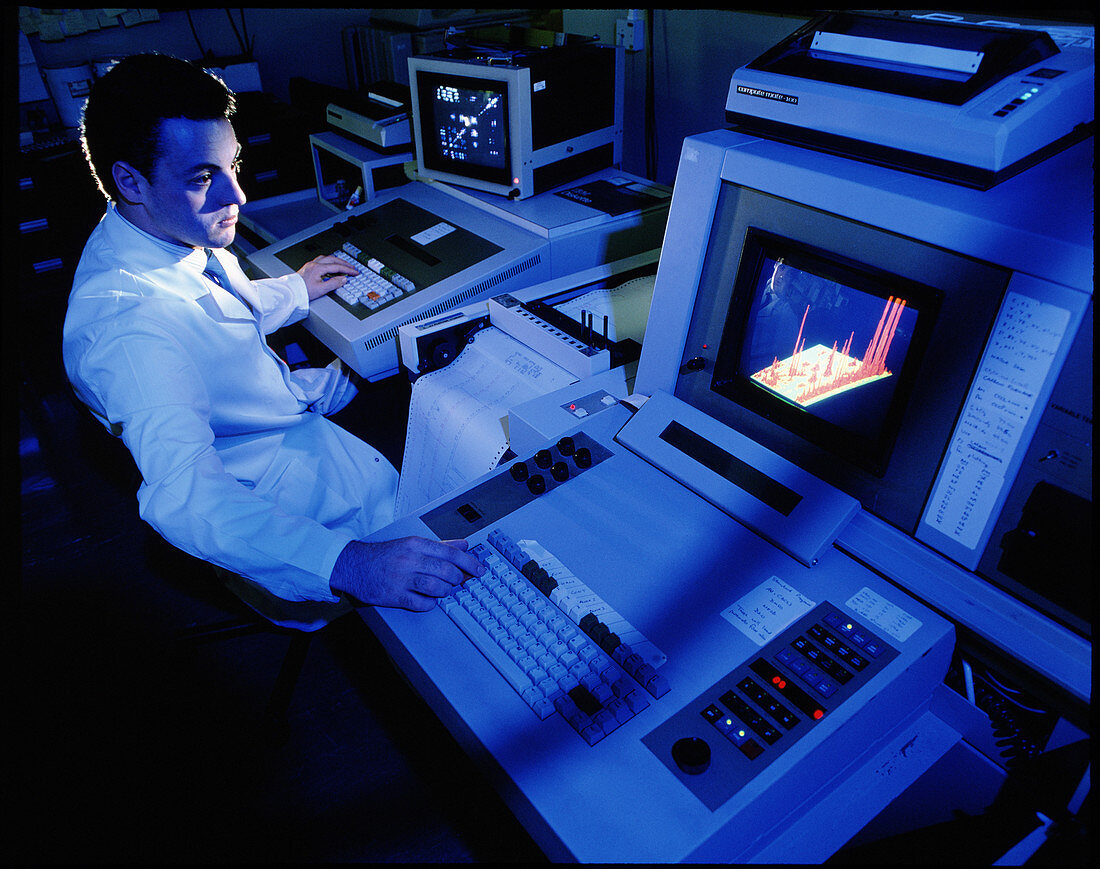
| MODEL RELEASED: NMR spectrometry. A scientist at the controls of a Nuclear Magnetic Resonance (NMR) spectrometer. This measures the resonance between an applied oscillating magnetic field and the magnetic moment of atoms. The display seen here is a '2D' trace. This is a plot of excitation frequency on one axis,resonance frequency on the second axis and response intensity in the vertical axis. This type of plot is used to identify the consituents of a compound and to give some data relating to its structure | |
| Licence : | Droits gérés |
| Crédit: | Science Photo Library / Tompkinson, Geoff |
| Taille de l’image : | 4277 px × 3378 px |
| Model Release : | Disponible |
| Property Release : | Non requis |
| Restrictions : | - |
Prix pour cette image À partir de 45 €
Produit vendu
(Calendrier, Carte postale, Carte de vœux, Impression sur textile, Packaging etc)
À partir de 45 €
Usage commercial
(Affichage, Annonce presse, Annonce TV, Carte, Digital - hors rés. sociaux, Digital - rés. sociaux etc)
À partir de 45 €
Éditorial
(Digital, Journal, Livre, Livre pratique, Magazine, Télévision etc)
À partir de 60 €
Usage non-commercial
(Digital - hors rés. sociaux, Digital - rés. sociaux etc)
À partir de 120 €