Building,thermogram
Numéro d’image : 11900892
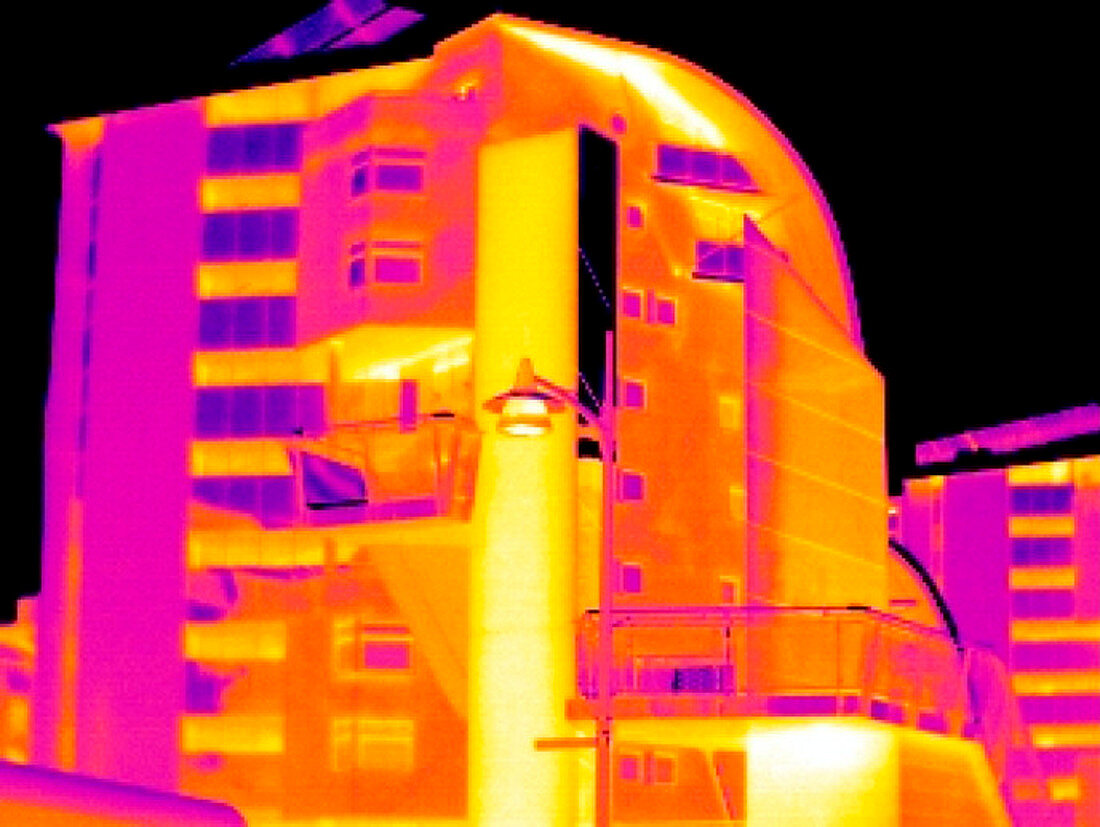
| Building,thermogram. A thermogram shows variation in temperature on the surface of an object,measured by the long-wave infrared radiation it emits. The temperature scale is colour-coded and runs from black (coldest,-14 degrees Celsius) through purple and orange,to white (warmest,1.0 degree Celsius). This imaging technique can be used to check the energy efficiency of buildings. The areas that appear hotter in a thermogram are where heat is being lost | |
| Licence : | Droits gérés |
| Crédit: | Science Photo Library / T-Service |
| Taille de l’image : | 688 px × 517 px |
| Model Release : | Non requis |
| Property Release : | Non requis |
| Restrictions : |
|
Prix pour cette image À partir de 45 €
Produit vendu
(Calendrier, Carte postale, Carte de vœux, Impression sur textile, Packaging etc)
À partir de 45 €
Usage commercial
(Affichage, Annonce presse, Annonce TV, Carte, Digital - hors rés. sociaux, Digital - rés. sociaux etc)
À partir de 45 €
Éditorial
(Digital, Journal, Livre, Livre pratique, Magazine, Télévision etc)
À partir de 60 €
Usage non-commercial
(Digital - hors rés. sociaux, Digital - rés. sociaux etc)
À partir de 120 €
Mots clés
- architecture,
- bâtiment,
- caméra infrarouge,
- chaleur,
- coloré,
- colorié,
- colorisé,
- conception,
- design,
- efficace,
- efficacité,
- efficient,
- froid,
- imagerie thermique,
- infrarouge,
- IR,
- isolation,
- rayonnement infrarouge à grandes longueurs d'onde,
- technologie,
- technologie de la construction,
- technologique,
- thermogramme,
- thermographie