Electricity pylons,thermogram
Numéro d’image : 11892685
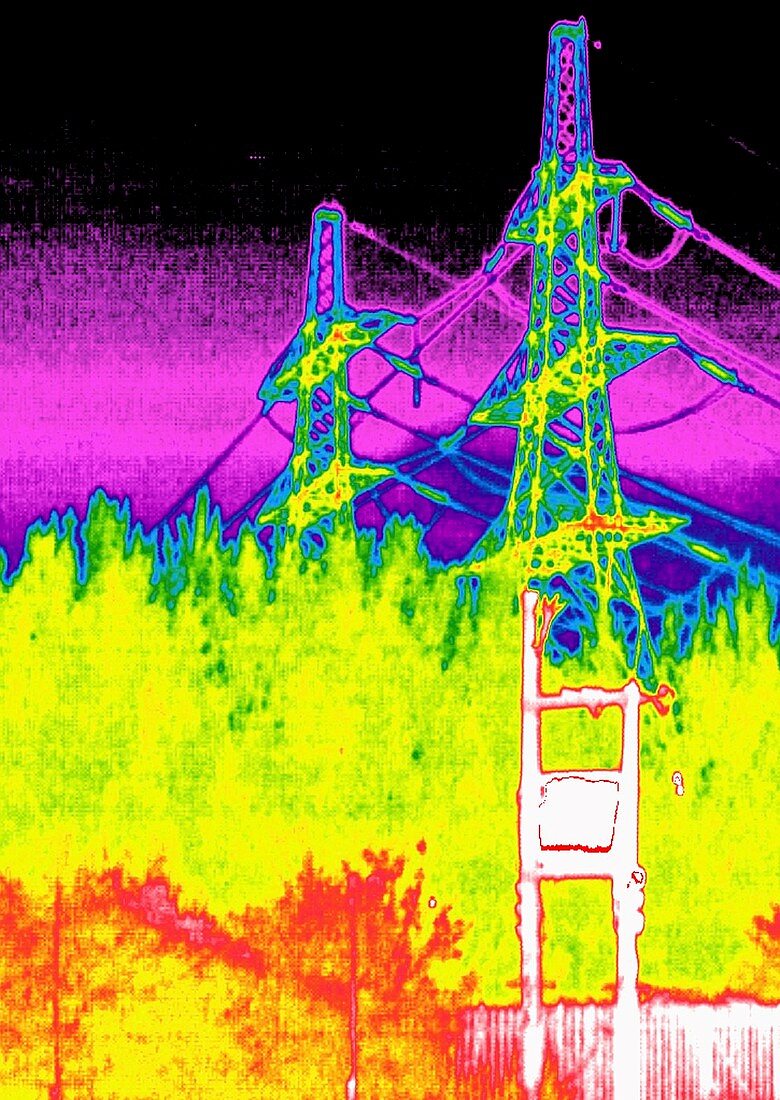
| Electricity pylons above trees,thermogram. A thermogram shows the variation in temperature on the surface of an object,measured by the long-wave infrared radiation it emits. The temperature scale is colour-coded and runs from black (coldest) through mauve,blue,green,yellow,orange,red and pink to white (warmest) | |
| Licence : | Droits gérés |
| Crédit: | Science Photo Library / McConnell, Tony |
| Taille de l’image : | 1115 px × 1573 px |
| Model Release : | Non requis |
| Property Release : | Non requis |
| Restrictions : | - |
Prix pour cette image À partir de 45 €
Produit vendu
(Calendrier, Carte postale, Carte de vœux, Impression sur textile, Packaging etc)
À partir de 45 €
Usage commercial
(Affichage, Annonce presse, Annonce TV, Carte, Digital - hors rés. sociaux, Digital - rés. sociaux etc)
À partir de 45 €
Éditorial
(Digital, Journal, Livre, Livre pratique, Magazine, Télévision etc)
À partir de 60 €
Usage non-commercial
(Digital - hors rés. sociaux, Digital - rés. sociaux etc)
À partir de 120 €
Mots clés
- aider,
- appui,
- arbres,
- câble,
- câbles,
- caméra infrarouge,
- campagne,
- chaleur,
- chaud,
- coloré,
- colorié,
- colorisé,
- électricité,
- électrique,
- énergie,
- environnement,
- industrie,
- infrarouge,
- IR,
- ligne d'alimentation,
- ligne électrique,
- lignes,
- physique,
- pylône électrique,
- pylônes,
- région boisée,
- soutien,
- structure,
- support,
- supporter,
- technologie,
- technologique,
- thermique,
- thermogramme,
- thermographie,
- transmission