Doppler shift of spectral lines
Numéro d’image : 11887186
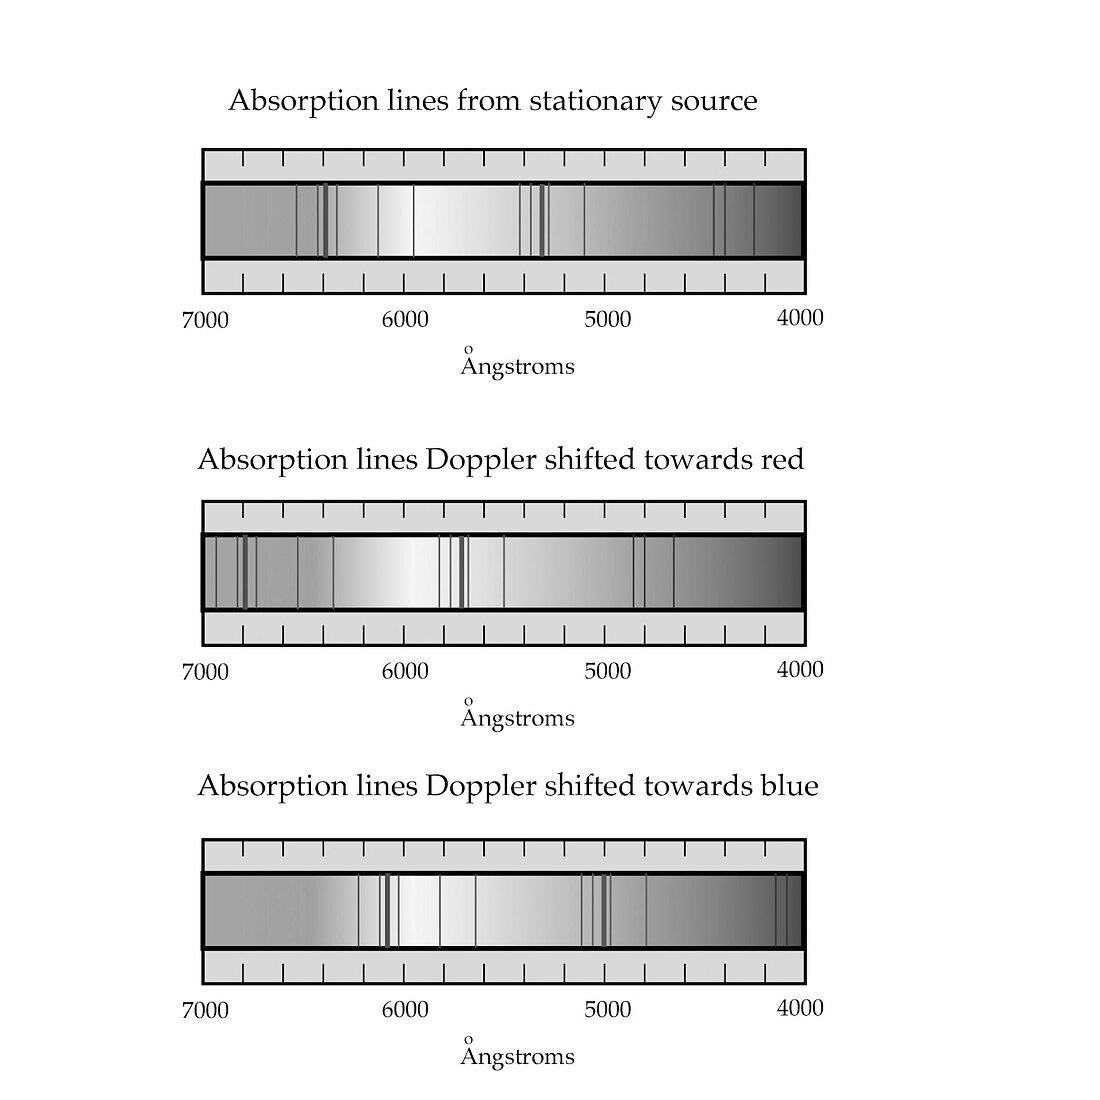
| Doppler shift of spectral lines. Diagram of three spectra with the changing positions of absorption lines (dark bars) in light from stationary (top),receding (centre) and approaching (lower) stars. The spectra show the wavelength range over the visible part of the electromagnetic spectrum,from red (7000 Angstroms) to blue (4000 Angstroms). The absorption lines are red-shifted for objects that are receding and blue-shifted for objects that are approaching. The effect,noticeable when the speed is comparable to that of light,is used to measure the recession speeds of distant galaxies,and help calculate the age of the universe | |
| Licence : | Droits gérés |
| Crédit: | Science Photo Library / Lomberg, Jon |
| Taille de l’image : | 1500 px × 1500 px |
| Model Release : | Non requis |
| Property Release : | Non requis |
| Restrictions : | - |
Prix pour cette image À partir de 45 €
Produit vendu
(Calendrier, Carte postale, Carte de vœux, Impression sur textile, Packaging etc)
À partir de 45 €
Usage commercial
(Affichage, Annonce presse, Annonce TV, Carte, Digital - hors rés. sociaux, Digital - rés. sociaux etc)
À partir de 45 €
Éditorial
(Digital, Journal, Livre, Livre pratique, Magazine, Télévision etc)
À partir de 60 €
Usage non-commercial
(Digital - hors rés. sociaux, Digital - rés. sociaux etc)
À partir de 120 €
Mots clés
- astronomie,
- astronomique,
- astrophysiques,
- cosmologie,
- effet doppler,
- espace,
- étendre,
- expansion,
- extension,
- illustration,
- léger,
- ligne absorption,
- lignes,
- longuers d'onde,
- longueur d'onde,
- monochrome,
- oeuvre,
- physique,
- radiation électromagnétique,
- rayonnement électromagnétique,
- récession,
- schéma,
- science,
- spectral,
- spectre,
- spectres,
- spectroscopie,
- spectrum,
- univers,
- vélocité,
- vitesse