Galaxy map
Numéro d’image : 11887174
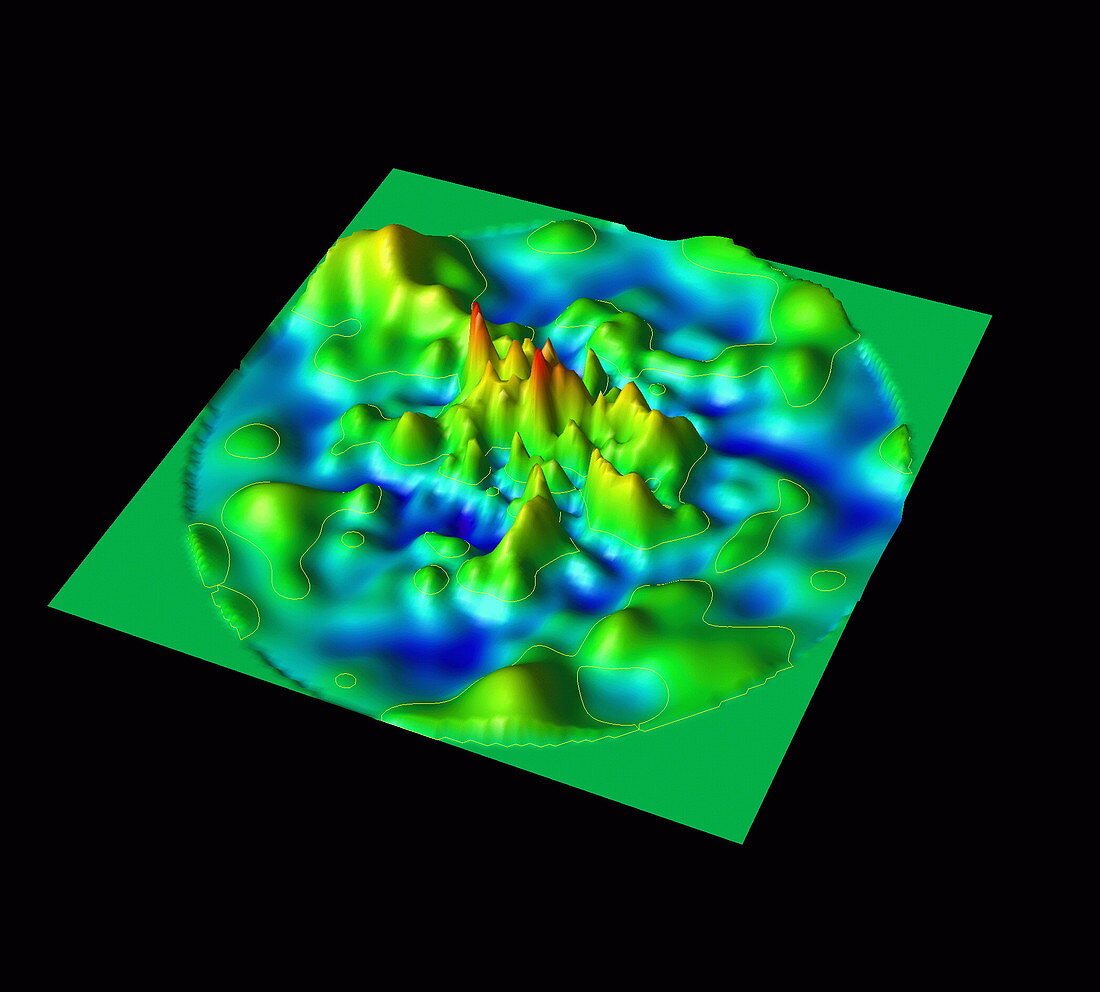
| Galaxy map. Computer-generated model of galaxies in our region of the Universe. Space density is indicated by colour,increasing from blue through to red. The map shows how galaxies located up to a distance of 600 million years away are distributed in space. It helps cosmologists to understand how galaxies behave and how our local universe has evolved. It was constructed from red shift data from over 15,500 galaxies. The red shift of a galaxy is an indication of its distance from the observer. Seen here is a section along the supergalactic plane,a reference plane passing through our Sun and the centre of our galaxy | |
| Licence : | Droits gérés |
| Crédit: | Science Photo Library / DURHAM UNIVERSITY / CARLOS FRENK |
| Taille de l’image : | 2085 px × 1880 px |
| Model Release : | Non requis |
| Property Release : | Non requis |
| Restrictions : | - |
Prix pour cette image À partir de 45 €
Produit vendu
(Calendrier, Carte postale, Carte de vœux, Impression sur textile, Packaging etc)
À partir de 45 €
Usage commercial
(Affichage, Annonce presse, Annonce TV, Carte, Digital - hors rés. sociaux, Digital - rés. sociaux etc)
À partir de 45 €
Éditorial
(Digital, Journal, Livre, Livre pratique, Magazine, Télévision etc)
À partir de 60 €
Usage non-commercial
(Digital - hors rés. sociaux, Digital - rés. sociaux etc)
À partir de 120 €