Computer simulation of the Sun's oscillations
Numéro d’image : 11884057
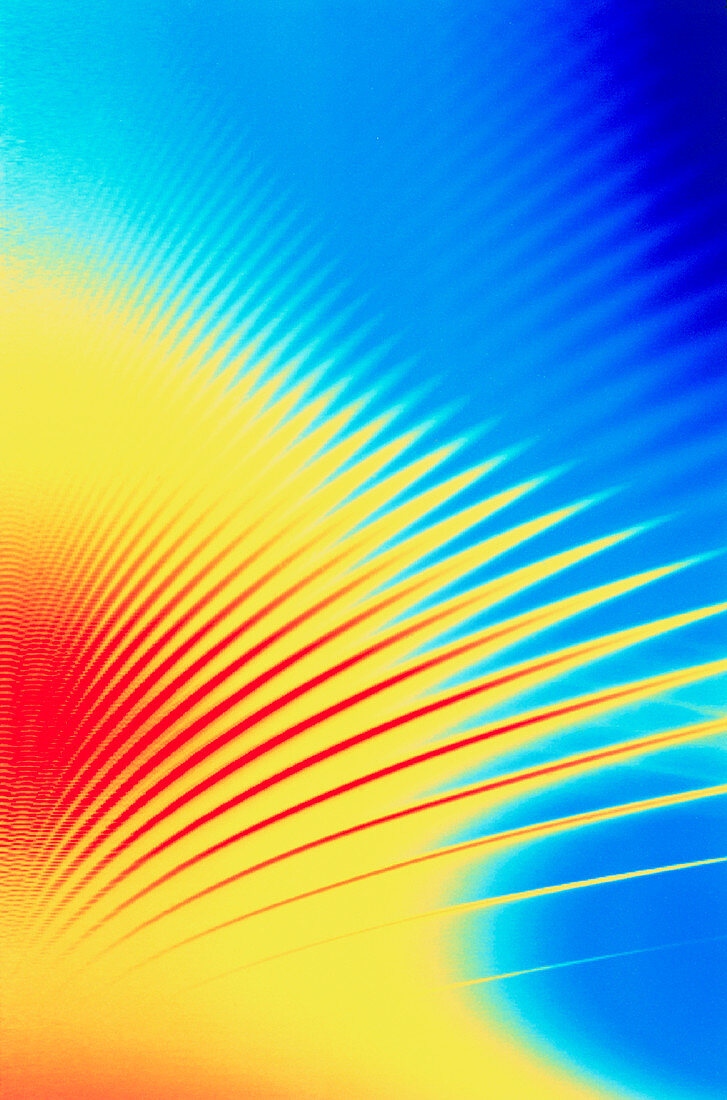
| Sun's oscillations. Graph of the Sun's oscilla- tions due to resonating soundwaves,drawn using data from the SOHO (Solar Heliospheric Observa- tory) satellite. The vertical scale represents frequency and the horizontal axis represents an inverse function of wavelength. The power density of waves with different combinations of these two properties is colour-coded from low (dark blue) through light blue,green & yellow to red (high). These oscillations reveal details of the Sun's internal composition & structure. Image produced by the Michelson Doppler Imager instrument | |
| Licence : | Droits gérés |
| Crédit: | Science Photo Library / ESA |
| Taille de l’image : | 3414 px × 5163 px |
| Model Release : | Non requis |
| Property Release : | Non requis |
| Restrictions : |
|
Prix pour cette image À partir de 45 €
Produit vendu
(Calendrier, Carte postale, Carte de vœux, Impression sur textile, Packaging etc)
À partir de 45 €
Usage commercial
(Affichage, Annonce presse, Annonce TV, Carte, Digital - hors rés. sociaux, Digital - rés. sociaux etc)
À partir de 45 €
Éditorial
(Digital, Journal, Livre, Livre pratique, Magazine, Télévision etc)
À partir de 60 €
Usage non-commercial
(Digital - hors rés. sociaux, Digital - rés. sociaux etc)
À partir de 120 €