Thermogram of feet wearing trainers
Numéro d’image : 11877007
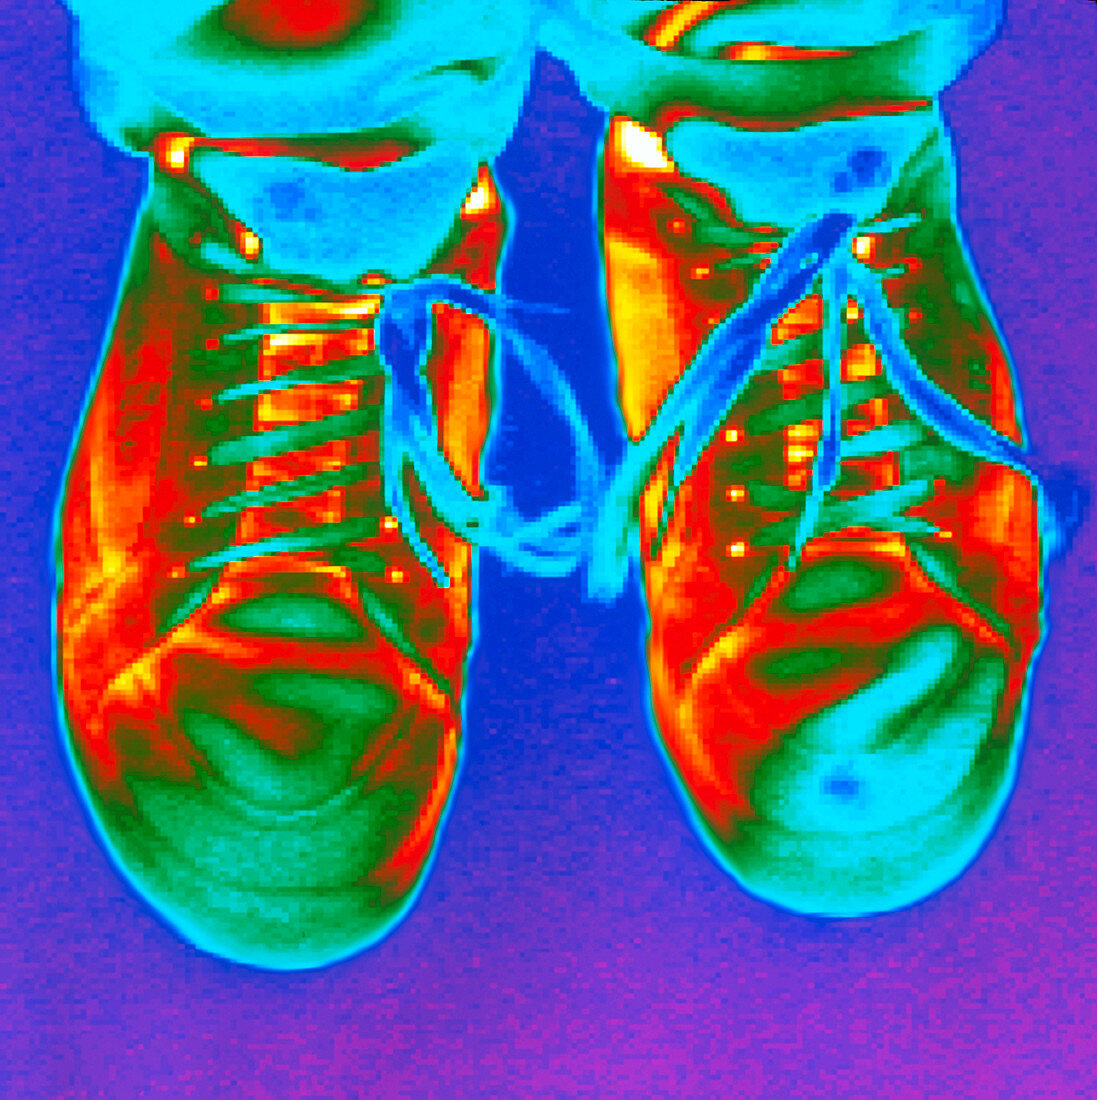
| Feet in trainers. Thermogram of a person's feet wearing trainers. The image shows the variation of surface temperature. The temperature scale runs from red (warmest) through yellow,green,cyan and blue to mauve (coldest). Thermography is a technique for visualising the temperature of surfaces by recording their emission of long- wavelength infrared radiation. This heat radiation is detected electronically and displayed with different colours representing different temperatures | |
| Licence : | Droits gérés |
| Crédit: | Science Photo Library / Tucker, Dr. Arthur |
| Taille de l’image : | 3053 px × 3061 px |
| Model Release : | Non requis |
| Property Release : | Non requis |
| Restrictions : | - |
Prix pour cette image À partir de 45 €
Produit vendu
(Calendrier, Carte postale, Carte de vœux, Impression sur textile, Packaging etc)
À partir de 45 €
Usage commercial
(Affichage, Annonce presse, Annonce TV, Carte, Digital - hors rés. sociaux, Digital - rés. sociaux etc)
À partir de 45 €
Éditorial
(Digital, Journal, Livre, Livre pratique, Magazine, Télévision etc)
À partir de 60 €
Usage non-commercial
(Digital - hors rés. sociaux, Digital - rés. sociaux etc)
À partir de 120 €