Human hand,thermogram
Numéro d’image : 11876172
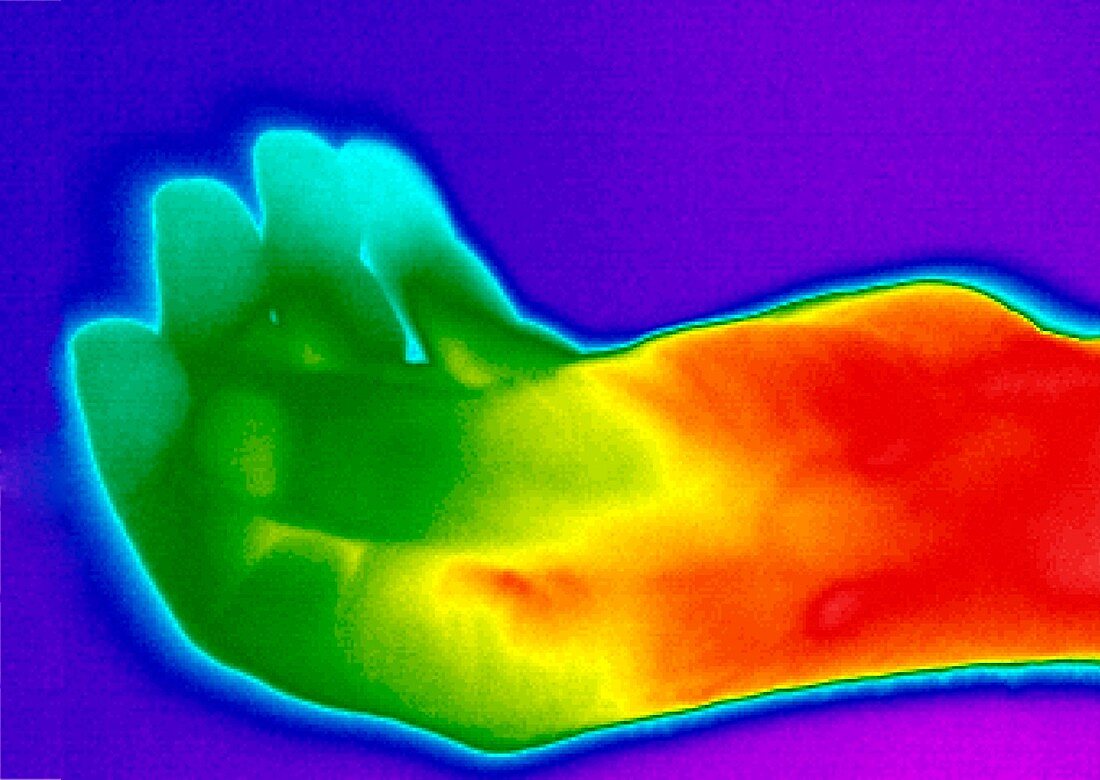
| Human hand,thermogram. A thermogram shows the variation in temperature on the surface of an object,measured by the long-wave infrared radiation it emits. The temperature scale is colour-coded and runs from purple (coldest),through blue,green,yellow and orange to red (warmest). In cold conditions,the human body reduces blood flow to the extremities,causing them to feel cold | |
| Licence : | Droits gérés |
| Crédit: | Science Photo Library / T-Service |
| Taille de l’image : | 3522 px × 2498 px |
| Model Release : | Non requis |
| Property Release : | Non requis |
| Restrictions : |
|
Prix pour cette image À partir de 45 €
Produit vendu
(Calendrier, Carte postale, Carte de vœux, Impression sur textile, Packaging etc)
À partir de 45 €
Usage commercial
(Affichage, Annonce presse, Annonce TV, Carte, Digital - hors rés. sociaux, Digital - rés. sociaux etc)
À partir de 45 €
Éditorial
(Digital, Journal, Livre, Livre pratique, Magazine, Télévision etc)
À partir de 60 €
Usage non-commercial
(Digital - hors rés. sociaux, Digital - rés. sociaux etc)
À partir de 120 €
Mots clés
- 1,
- adulte,
- anatomie,
- anatomique,
- biologie,
- biologique,
- bout des doigts,
- caméra infrarouge,
- chaleur,
- coloré,
- colorié,
- colorisé,
- corps humain,
- doigts,
- endotherme,
- endothermique,
- extrémités,
- flux sanguin,
- froid,
- gens,
- homéostasie,
- humain,
- infrarouge,
- IR,
- main,
- personne,
- rayonnement infrarouge à grandes longueurs d'onde,
- seul,
- surface,
- thermogramme,
- thermographie,
- un,
- unique,
- vrai