Weight-for-stature chart
Numéro d’image : 11861119
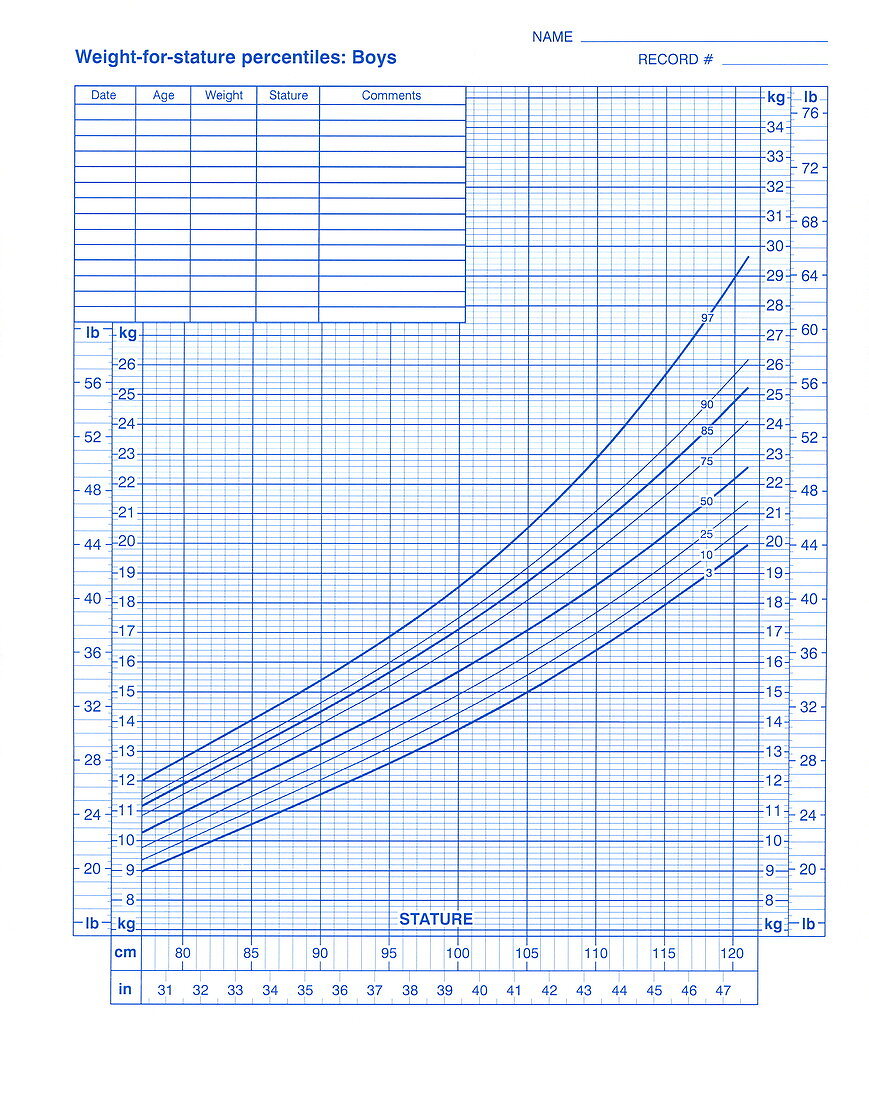
| Weight-for-stature chart. This chart is used to determine whether boys are a healthy weight comparative to their height (stature). By finding the point on this graph where a child's height (bottom) and weight (side) intersect,it can be determined whether the child is underweight,healthy,at risk of becoming overweight or overweight. The lines on this graph are percentile curves,if a child's weight and height values intersect between the 85th and 95th percentile then 85-95 per cent of children at that height weigh less and the child is at risk of becoming overweight. However,these charts are not considered to be as accurate as body mass index charts | |
| Licence : | Droits gérés |
| Crédit: | Science Photo Library / CDC |
| Taille de l’image : | 3715 px × 4701 px |
| Model Release : | Non requis |
| Property Release : | Non requis |
| Restrictions : | - |
Prix pour cette image À partir de 45 €
Produit vendu
(Calendrier, Carte postale, Carte de vœux, Impression sur textile, Packaging etc)
À partir de 45 €
Usage commercial
(Affichage, Annonce presse, Annonce TV, Carte, Digital - hors rés. sociaux, Digital - rés. sociaux etc)
À partir de 45 €
Éditorial
(Digital, Journal, Livre, Livre pratique, Magazine, Télévision etc)
À partir de 60 €
Usage non-commercial
(Digital - hors rés. sociaux, Digital - rés. sociaux etc)
À partir de 120 €
Mots clés
- américain,
- bleu,
- comparaison,
- comparatif,
- courbe,
- courber,
- courbes,
- diagramme,
- embonpoint,
- en bonne santé,
- enfant,
- enfants,
- gamme,
- gammes,
- garçons,
- graphique,
- hauteur,
- ligne,
- lignes,
- maigreur,
- médecine,
- médical,
- médicale,
- mesure,
- normal,
- pédiatrie,
- plages,
- poids,
- poids insuffisant,
- risque,
- sain,
- sous-poids,
- sur-poids,
- tableau,
- taille