Non-smoker hand thermogram
Numéro d’image : 11846362
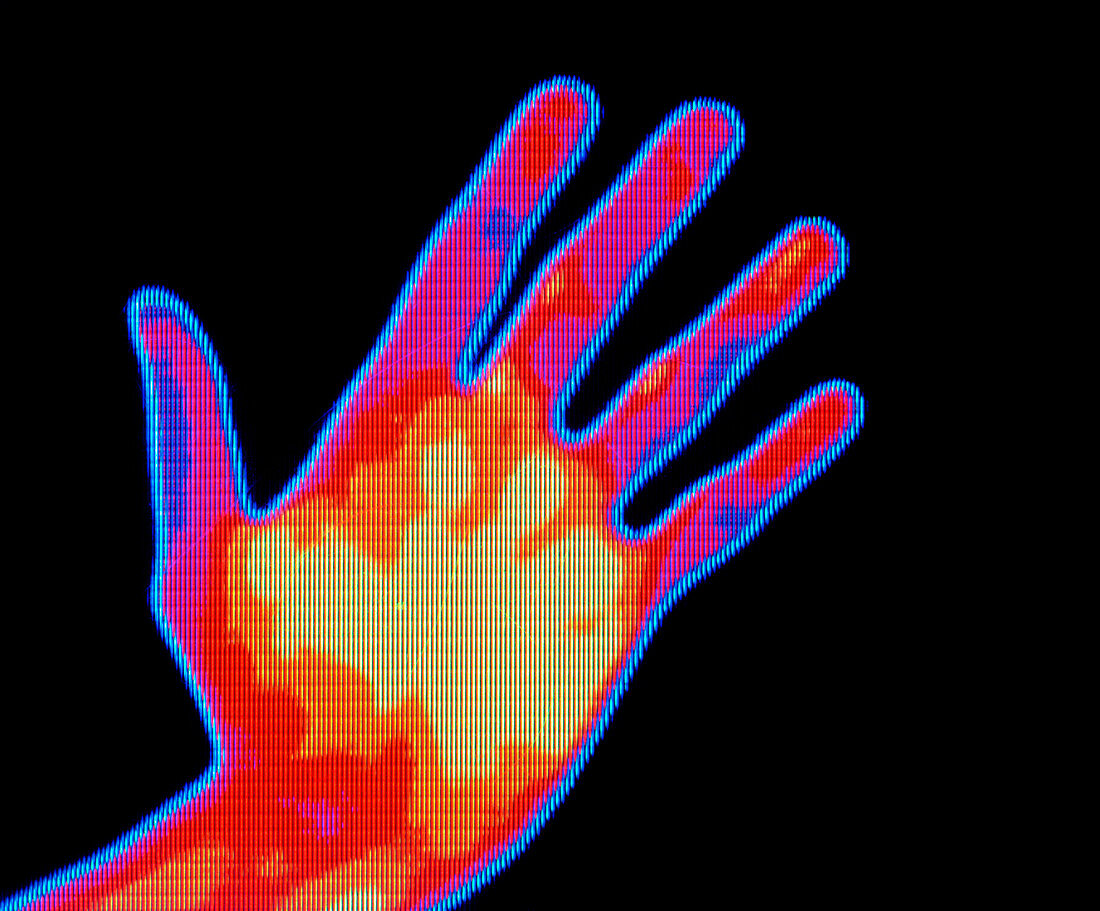
| Thermogram of the hand of a non-smoker,showing the temperature distribution associated with a healthy blood circulation (see M370/225 for comparison). Thermography is an imaging technique for mapping the heat distribution over the surface of a body. Here,the colour-coded image shows temperature variation in 0.1 degree celsius steps (see scale at left),where blue corresponds to the colder areas and yellow corresponds to the hotter areas. Thermography can provide clues to the presence of diseases and abnormalities that alter the temperature of the skin,such as circulatory problems,inflammation,and tumours | |
| Licence : | Droits gérés |
| Crédit: | Science Photo Library / Pasieka, Alfred |
| Taille de l’image : | 4112 px × 3404 px |
| Model Release : | Non requis |
| Property Release : | Non requis |
| Restrictions : | - |
Prix pour cette image À partir de 45 €
Produit vendu
(Calendrier, Carte postale, Carte de vœux, Impression sur textile, Packaging etc)
À partir de 45 €
Usage commercial
(Affichage, Annonce presse, Annonce TV, Carte, Digital - hors rés. sociaux, Digital - rés. sociaux etc)
À partir de 45 €
Éditorial
(Digital, Journal, Livre, Livre pratique, Magazine, Télévision etc)
À partir de 60 €
Usage non-commercial
(Digital - hors rés. sociaux, Digital - rés. sociaux etc)
À partir de 120 €
Mots clés
- abus,
- chaleur corporelle,
- cigarette,
- coupé,
- coupe-circuit,
- découpé,
- découpes,
- détourages,
- détouré,
- diagnostic,
- diagnostics,
- diagnostique,
- diagnostiques,
- disjoncteur,
- doigts,
- drogue,
- drogue à usage récréatif,
- drogues récréatives,
- état,
- fumant,
- fumer,
- médecine,
- médical,
- médicale,
- mode de vie,
- silhouette,
- soins de santé,
- style de vie,
- thermogramme