Hypertension
Numéro d’image : 11840207
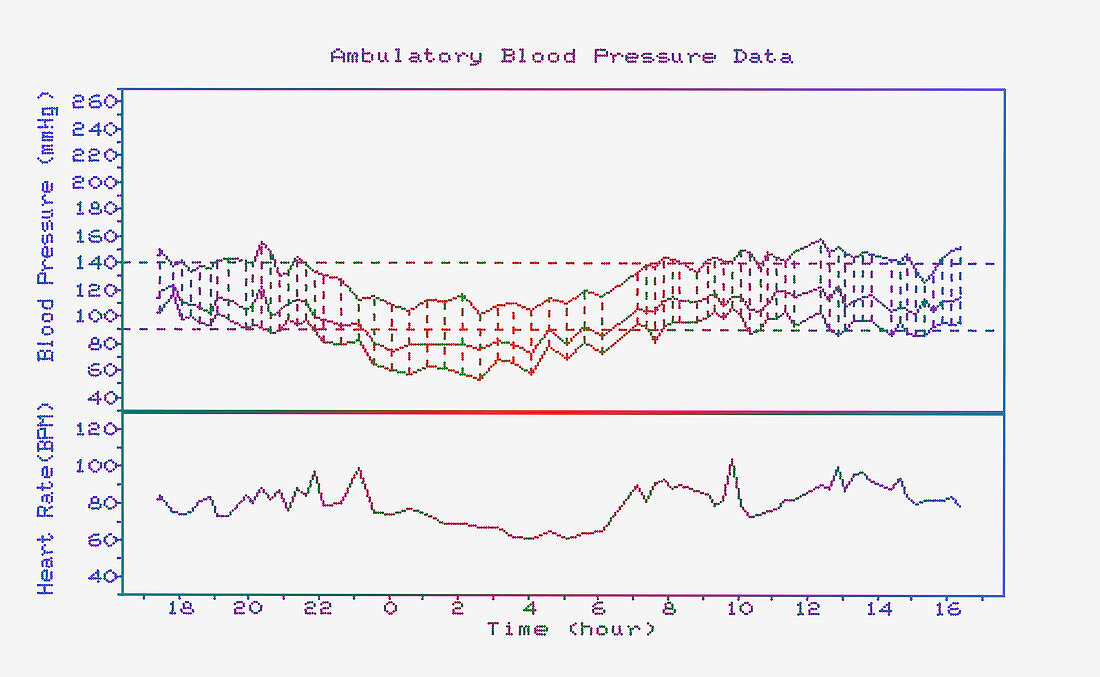
| Hypertension. Graph of the blood pressure of a man with mild hypertension (high blood pressure). The man wore an ambulatory blood pressure monitor for about 24 hours. The lower graph shows his heart rate in beats per minute (BPM). Time of day lies on the lower axis. The three blood pressures,given in millimetres of mercury (mmHg),are (from top to bottom): systolic,mean arterial and diastolic. The lower dotted line marks the upper limit of healthy diastolic pressure,the pressure between heartbeats,while the upper dotted line shows the upper limit of healthy systolic pressure,the pressure during a heartbeat. During the day these limits were generally exceeded | |
| Licence : | Droits gérés |
| Crédit: | Science Photo Library / Marazzi, Dr. P. |
| Taille de l’image : | 4971 px × 3061 px |
| Model Release : | Non requis |
| Property Release : | Non requis |
| Restrictions : | - |
Prix pour cette image À partir de 45 €
Produit vendu
(Calendrier, Carte postale, Carte de vœux, Impression sur textile, Packaging etc)
À partir de 45 €
Usage commercial
(Affichage, Annonce presse, Annonce TV, Carte, Digital - hors rés. sociaux, Digital - rés. sociaux etc)
À partir de 45 €
Éditorial
(Digital, Journal, Livre, Livre pratique, Magazine, Télévision etc)
À partir de 60 €
Usage non-commercial
(Digital - hors rés. sociaux, Digital - rés. sociaux etc)
À partir de 120 €
Mots clés
- anormal,
- carte,
- data,
- désordre,
- diagnostic,
- diagnostics,
- diagnostique,
- diagnostiques,
- donnée,
- élevé,
- état,
- graphiques,
- haut,
- haute,
- hypertension,
- maladie,
- malsain,
- médecine,
- médical,
- médicale,
- moniteur de pression artérielle,
- moniteur de pression sanguine,
- pathologie,
- pulsation cardique,
- soins de santé,
- taux,
- tensiomètre,
- trouble,
- vaisseau sanguin,
- vasculaire