Thermogram of legs showing deep vein thrombosis
Numéro d’image : 11840117
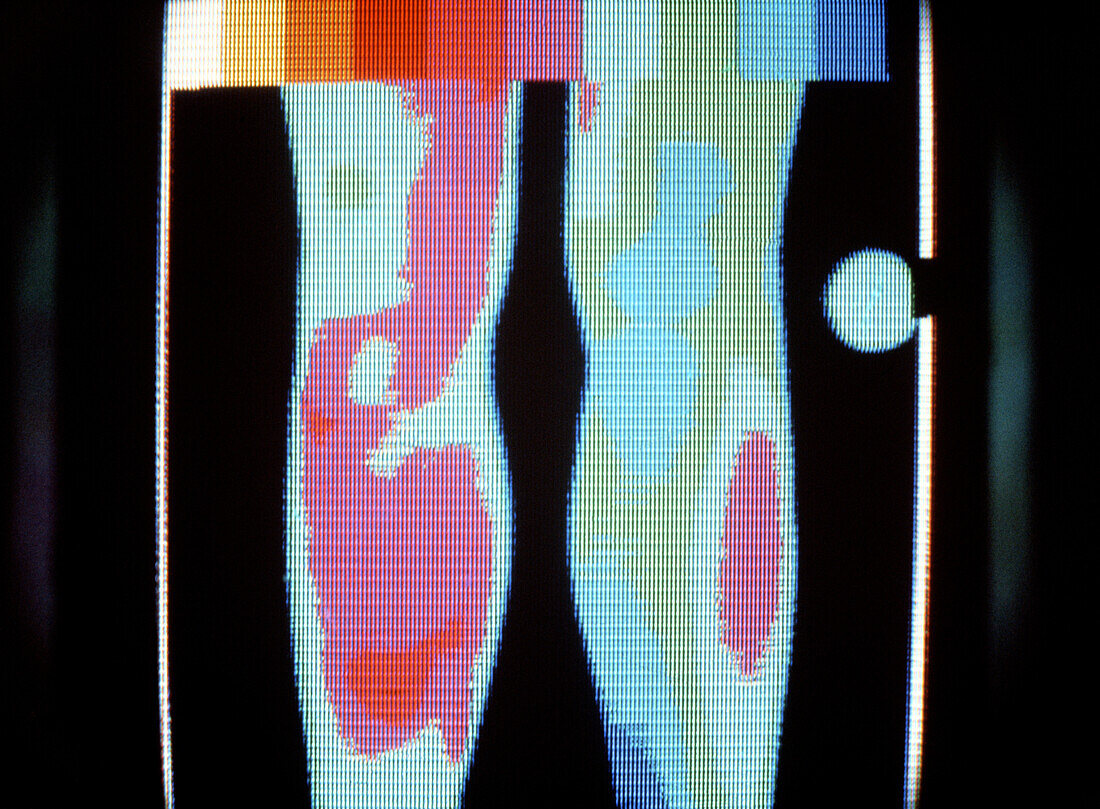
| Thermogram of the lower legs,showing the heat distribution pattern of a deep vein thrombosis in the left calf. The obvious increase in temperature over the left leg is due to inflammation associated with the formation of a blood clot in one of the deep veins. Blood clots formed in veins may be responsible for arterial obstructions in other parts of the circulation,since part of the clot may break away to subsequently lodge in and possibly block a small artery. Colour coding ranges from white (warm) to blue (cool),with colours representing steps of 1 degree C. The reference disc is calibrated at 30 degrees C | |
| Licence : | Droits gérés |
| Crédit: | Science Photo Library |
| Taille de l’image : | 4961 px × 3649 px |
| Model Release : | Non requis |
| Property Release : | Non requis |
| Restrictions : | - |
Prix pour cette image À partir de 45 €
Produit vendu
(Calendrier, Carte postale, Carte de vœux, Impression sur textile, Packaging etc)
À partir de 45 €
Usage commercial
(Affichage, Annonce presse, Annonce TV, Carte, Digital - hors rés. sociaux, Digital - rés. sociaux etc)
À partir de 45 €
Éditorial
(Digital, Journal, Livre, Livre pratique, Magazine, Télévision etc)
À partir de 60 €
Usage non-commercial
(Digital - hors rés. sociaux, Digital - rés. sociaux etc)
À partir de 120 €