Making tea,thermogram
Numéro d’image : 11832659
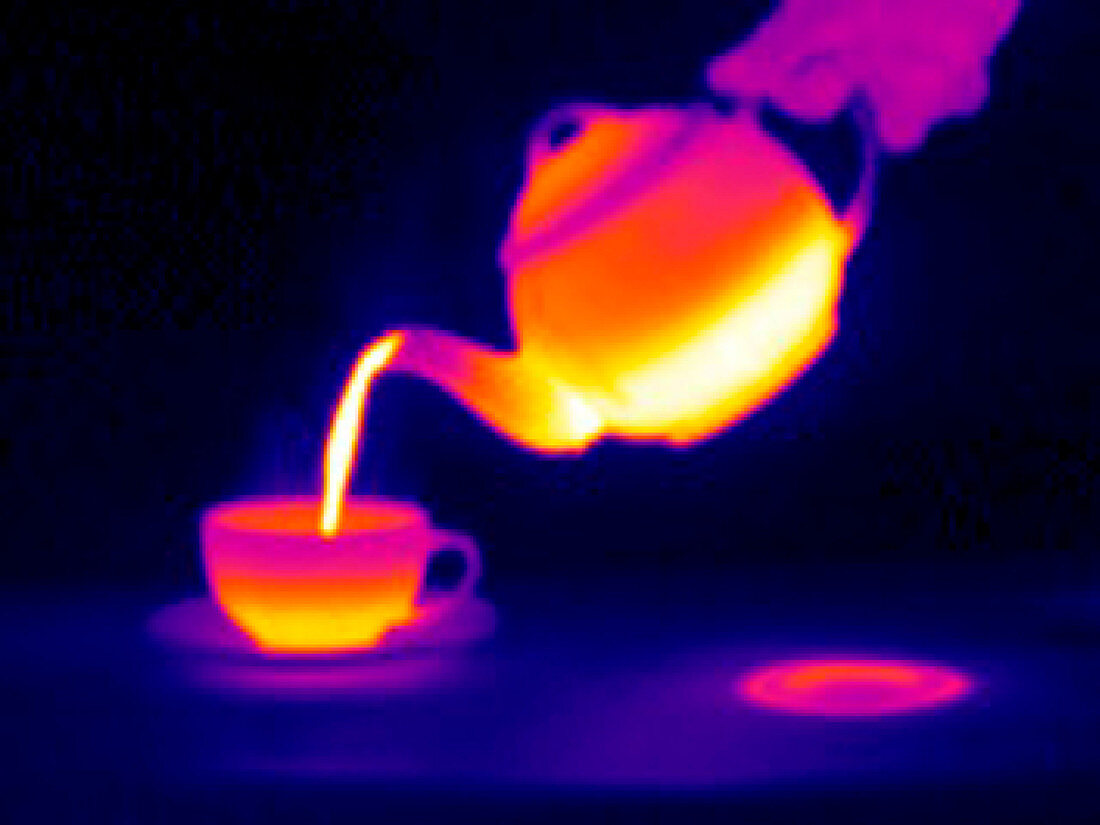
| Making a cup of tea. Image 3 of 4. Thermogram of a hand pouring tea from a teapot into a cup. The colours show variations in temperature. The scale runs from white (warmest),through yellow,orange,red and purple to blue (coldest). Thermography records the temperature of surfaces by detecting long-wavelength infrared radiation. The heat of the boiling tea is seen inside the teapot and also transferring heat to the cup. The teapot has also left a heat shadow where it rested on the surface at lower right. The handles of the cup and teapot remain cool due to little contact with the hot surfaces. For a sequence of thermograms showing a cup of tea being made,see images H584/103-106 | |
| Licence : | Droits gérés |
| Crédit: | Science Photo Library / McConnell, Tony |
| Taille de l’image : | 3533 px × 2650 px |
| Model Release : | Non requis |
| Property Release : | Non requis |
| Restrictions : | - |
Prix pour cette image À partir de 45 €
Produit vendu
(Calendrier, Carte postale, Carte de vœux, Impression sur textile, Packaging etc)
À partir de 45 €
Usage commercial
(Affichage, Annonce presse, Annonce TV, Carte, Digital - hors rés. sociaux, Digital - rés. sociaux etc)
À partir de 45 €
Éditorial
(Digital, Journal, Livre, Livre pratique, Magazine, Télévision etc)
À partir de 60 €
Usage non-commercial
(Digital - hors rés. sociaux, Digital - rés. sociaux etc)
À partir de 120 €
Mots clés
- boisson,
- céramique,
- chaleur,
- chaud,
- détecter,
- eau,
- ébullition,
- fabriquer,
- image thermique,
- infrarouge,
- IR,
- main,
- ombre,
- photo,
- photo thermique,
- photographie,
- pot,
- préparant,
- préparation,
- préparer,
- réaliser,
- science,
- scientifique,
- séquence,
- soucoupe,
- tasse,
- technique,
- techniques,
- technologie,
- température,
- thé,
- théière,
- thermique,
- thermogramme,
- thermographe,
- thermographie,
- verser