Making tea,thermogram
Numéro d’image : 11832658
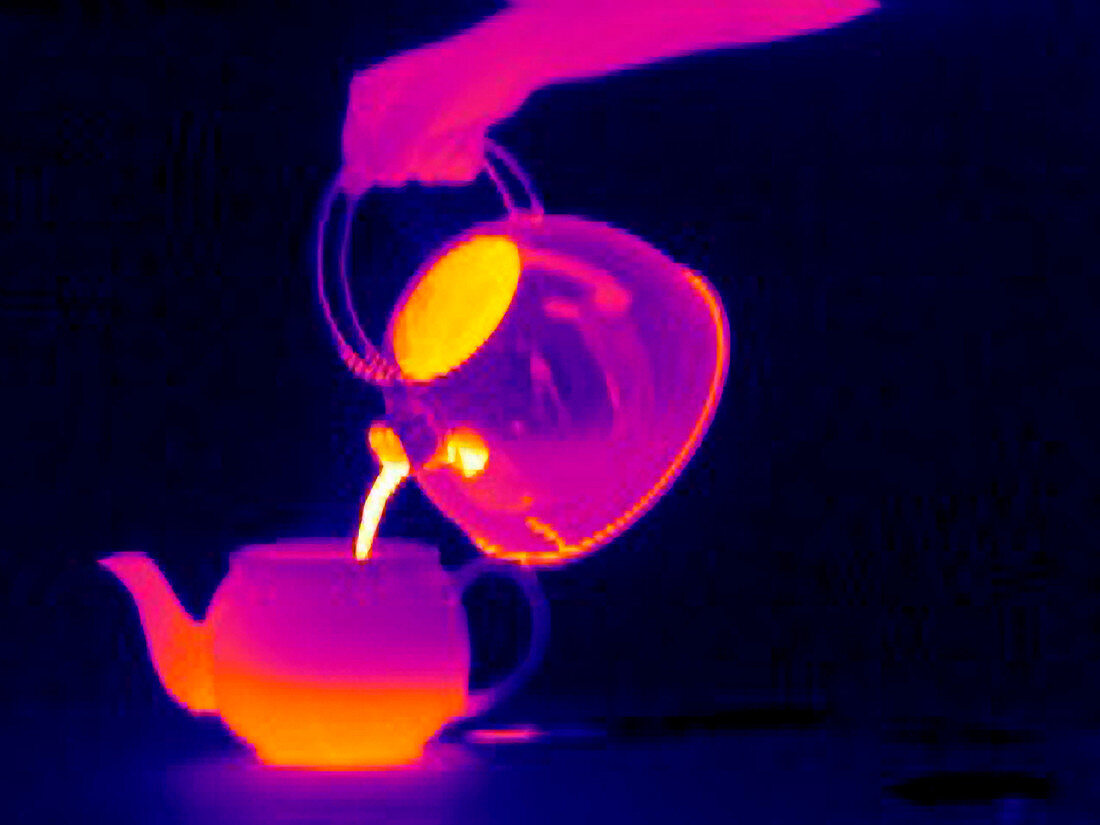
| Making a cup of tea. Image 2 of 4. Thermogram of a hand pouring boiling water from a kettle into a pot to make tea. The colours show variations in temperature. The scale runs from white (warmest),through yellow,orange,red and purple to blue (coldest). Thermography records the temperature of surfaces by detecting long-wavelength infrared radiation. The heat of the boiling water is seen as it fills the teapot,but less heat is lost than is seen escaping from the open lid of the kettle. The handles remain cool due to the little contact they have with the hot surfaces. For a sequence of thermograms showing a cup of tea being made,see images H584/103-106 | |
| Licence : | Droits gérés |
| Crédit: | Science Photo Library / McConnell, Tony |
| Taille de l’image : | 4827 px × 3620 px |
| Model Release : | Non requis |
| Property Release : | Non requis |
| Restrictions : | - |
Prix pour cette image À partir de 45 €
Produit vendu
(Calendrier, Carte postale, Carte de vœux, Impression sur textile, Packaging etc)
À partir de 45 €
Usage commercial
(Affichage, Annonce presse, Annonce TV, Carte, Digital - hors rés. sociaux, Digital - rés. sociaux etc)
À partir de 45 €
Éditorial
(Digital, Journal, Livre, Livre pratique, Magazine, Télévision etc)
À partir de 60 €
Usage non-commercial
(Digital - hors rés. sociaux, Digital - rés. sociaux etc)
À partir de 120 €
Mots clés
- boisson,
- bouilloire,
- céramique,
- chaleur,
- chaud,
- détecter,
- eau,
- ébullition,
- fabriquer,
- image thermique,
- infrarouge,
- IR,
- main,
- marmite,
- métal,
- photo,
- photo thermique,
- photographie,
- pot,
- préparant,
- préparation,
- préparer,
- réaliser,
- science,
- scientifique,
- séquence,
- technique,
- techniques,
- technologie,
- température,
- thé,
- théière,
- thermique,
- thermogramme,
- thermographe,
- thermographie,
- verser