Thermogram showing heat loss from a house
Numéro d’image : 11832641
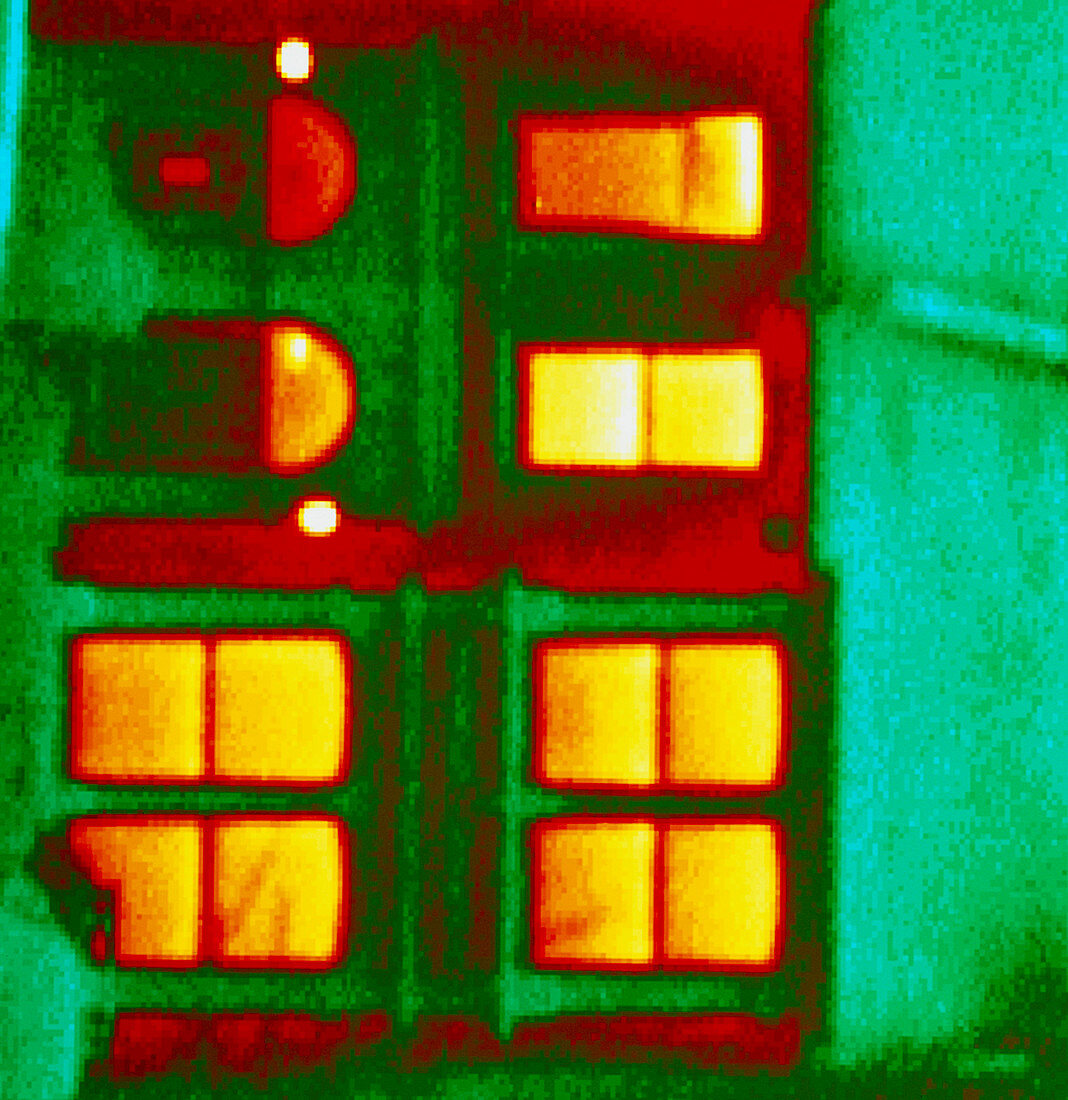
| Heat loss. Thermogram of a house showing the distribution of heat over its surface. The temperature scale runs from red (warmest) through yellow to green (coldest). Thermography is a technique for visualising the temperature of surfaces by recording their emission of long- wavelength variation. This heat radiation is detected electronically and displayed with different colours representing different temperature. This thermogram shows that the roof is well insulated,while the walls and windows are losing the heat. Thermograms are used to check houses for heat loss,so their heat insulation can be improved | |
| Licence : | Droits gérés |
| Crédit: | Science Photo Library / Tucker, Dr. Arthur |
| Taille de l’image : | 3210 px × 3307 px |
| Model Release : | Non requis |
| Property Release : | Non requis |
| Restrictions : | - |
Prix pour cette image À partir de 45 €
Produit vendu
(Calendrier, Carte postale, Carte de vœux, Impression sur textile, Packaging etc)
À partir de 45 €
Usage commercial
(Affichage, Annonce presse, Annonce TV, Carte, Digital - hors rés. sociaux, Digital - rés. sociaux etc)
À partir de 45 €
Éditorial
(Digital, Journal, Livre, Livre pratique, Magazine, Télévision etc)
À partir de 60 €
Usage non-commercial
(Digital - hors rés. sociaux, Digital - rés. sociaux etc)
À partir de 120 €