Thermogram showing heat loss from city buildings
Numéro d’image : 11832639
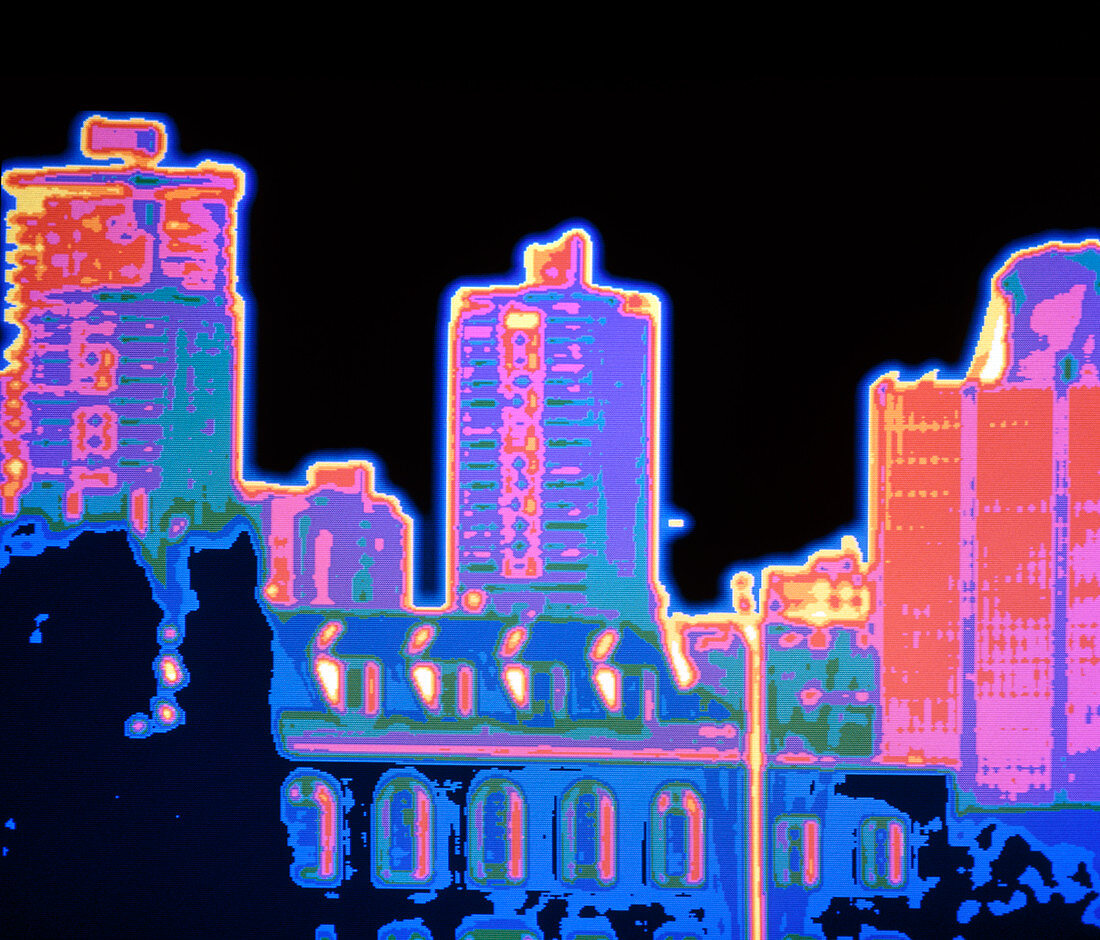
| Heat loss. Thermogram showing the distribution of heat over city buildings. The colour coding ranges from yellow and red for the warmest areas (greatest heat loss) through pink to purple and green for the coolest areas (lowest heat loss). Typically roofs and windows show greatest heat loss. Thermograms are often used to check buildings for heat loss,so that they can be made more energy efficient through improved insulation | |
| Licence : | Droits gérés |
| Crédit: | Science Photo Library / Pasieka, Alfred |
| Taille de l’image : | 4815 px × 4116 px |
| Model Release : | Non requis |
| Restrictions : | - |
Prix pour cette image À partir de 45 €
Produit vendu
(Calendrier, Carte postale, Carte de vœux, Impression sur textile, Packaging etc)
À partir de 45 €
Usage commercial
(Affichage, Annonce presse, Annonce TV, Carte, Digital - hors rés. sociaux, Digital - rés. sociaux etc)
À partir de 45 €
Éditorial
(Digital, Journal, Livre, Livre pratique, Magazine, Télévision etc)
À partir de 60 €
Usage non-commercial
(Digital - hors rés. sociaux, Digital - rés. sociaux etc)
À partir de 120 €
Mots clés
- bâtiment,
- bâtiments,
- building d'habitation,
- image thermique,
- immeuble d'habitation,
- immeubles,
- infrarouge,
- IR,
- maison,
- perte de chaleur,
- photo,
- photo thermique,
- photographie,
- science,
- scientifique,
- technique,
- techniques,
- technologie,
- thermogramme,
- thermographe,
- thermographie,
- tour d'habitation,
- ville