Colour thermogram of two office buildings
Numéro d’image : 11832637
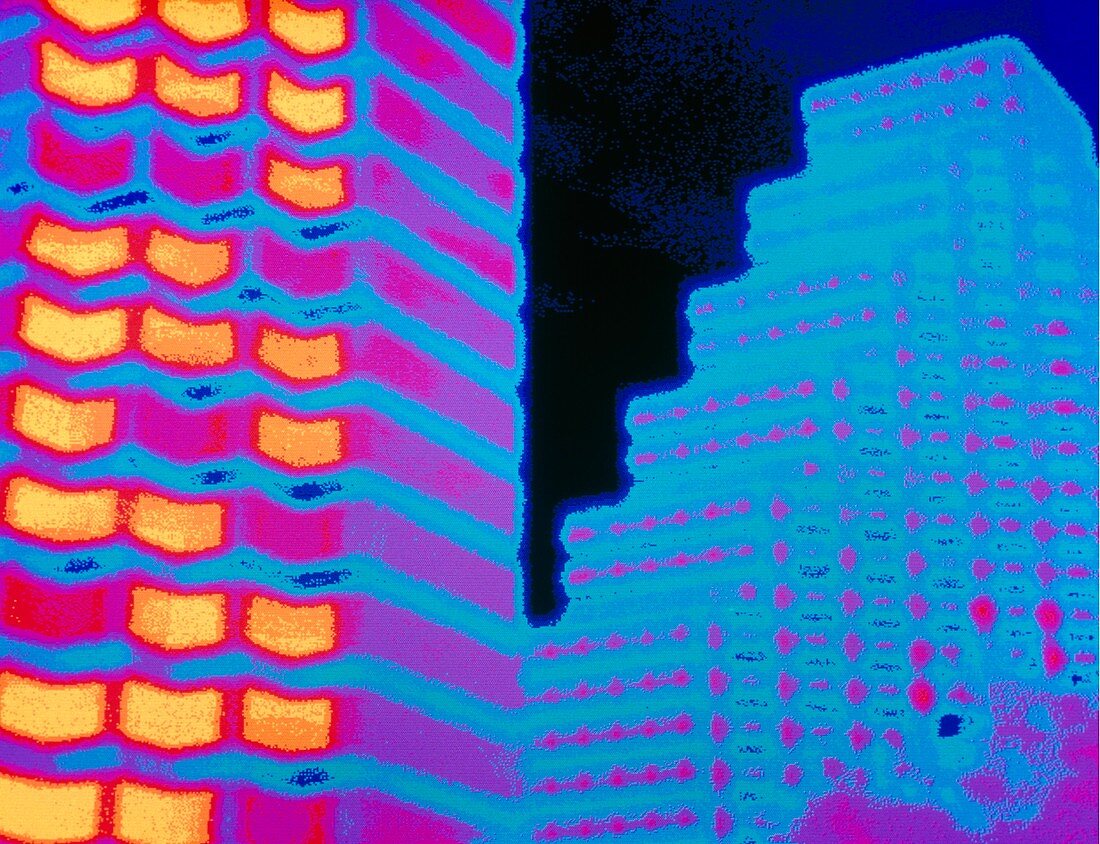
| Heat of office buildings. Coloured thermogram of the exterior of two office blocks,showing the distribution of surface temperature. The colour- coding is: red to orange to yellow (hottest areas); pink to purple to blue (coolest areas). The building at left reveals heat emanating from many of its windows facing left. These windows may be reflecting heat from the sun,or be emanating heat from the offices inside. The right facing wall of this building and both walls of the second building are cooler,with coolest regions being the solid structures between the windows | |
| Licence : | Droits gérés |
| Crédit: | Science Photo Library / Pasieka, Alfred |
| Taille de l’image : | 4842 px × 3714 px |
| Model Release : | Non requis |
| Property Release : | Non requis |
| Restrictions : | - |
Prix pour cette image À partir de 45 €
Produit vendu
(Calendrier, Carte postale, Carte de vœux, Impression sur textile, Packaging etc)
À partir de 45 €
Usage commercial
(Affichage, Annonce presse, Annonce TV, Carte, Digital - hors rés. sociaux, Digital - rés. sociaux etc)
À partir de 45 €
Éditorial
(Digital, Journal, Livre, Livre pratique, Magazine, Télévision etc)
À partir de 60 €
Usage non-commercial
(Digital - hors rés. sociaux, Digital - rés. sociaux etc)
À partir de 120 €