Thermogram of front of office block
Numéro d’image : 11832632
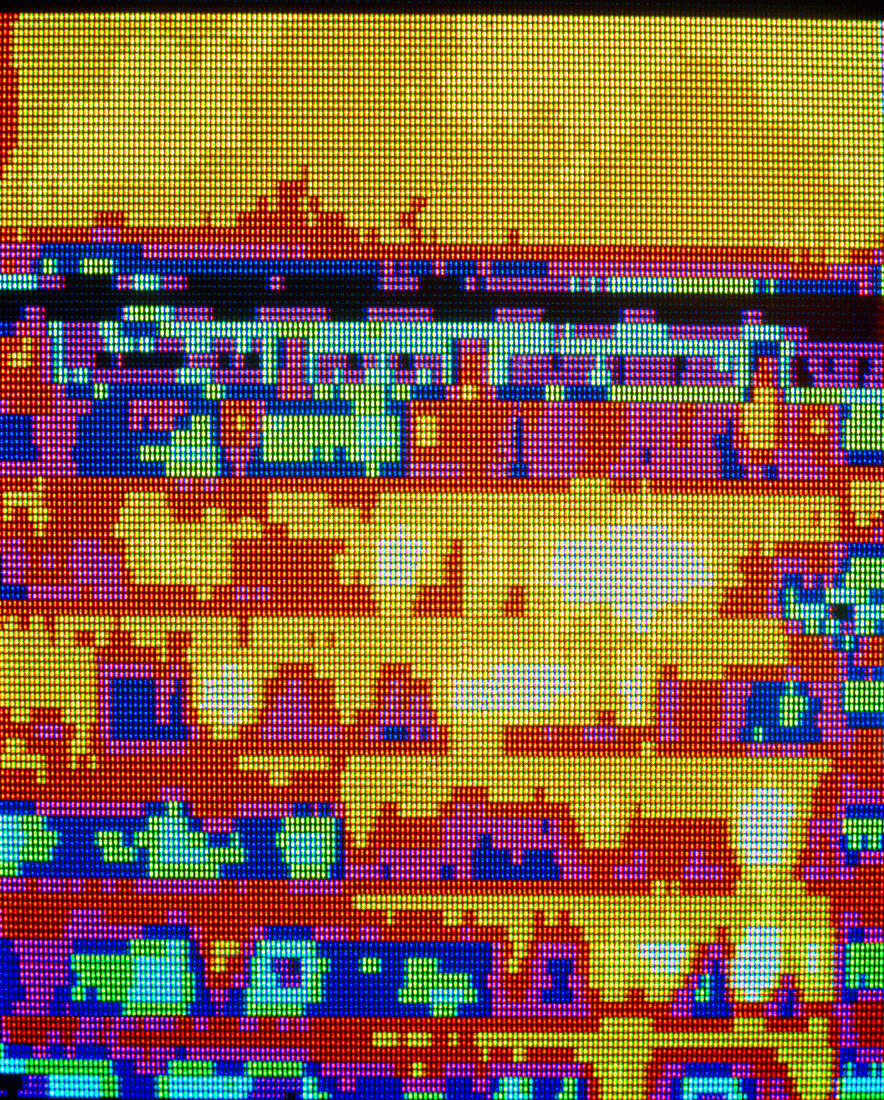
| Thermogram of the front of an office block showing the distribution of temperature across the exterior surface of the building. The colour chart runs from white/yellow the hottest regions through to light green/purple the coldest regions. Much of the building is cool,apearing in light green & purple. Some areas,however,are hot (white & yellow),indicating heat loss through windows. See H584/049 for ordinary 35mm photograph. Original is 6x7cm H584/041 | |
| Licence : | Droits gérés |
| Crédit: | Science Photo Library / Hart-Davis, Adam |
| Taille de l’image : | 3788 px × 4713 px |
| Model Release : | Non requis |
| Property Release : | Non requis |
| Restrictions : | - |
Prix pour cette image À partir de 45 €
Produit vendu
(Calendrier, Carte postale, Carte de vœux, Impression sur textile, Packaging etc)
À partir de 45 €
Usage commercial
(Affichage, Annonce presse, Annonce TV, Carte, Digital - hors rés. sociaux, Digital - rés. sociaux etc)
À partir de 45 €
Éditorial
(Digital, Journal, Livre, Livre pratique, Magazine, Télévision etc)
À partir de 60 €
Usage non-commercial
(Digital - hors rés. sociaux, Digital - rés. sociaux etc)
À partir de 120 €