Thermogram of heat loss from multi-storey office
Numéro d’image : 11832620
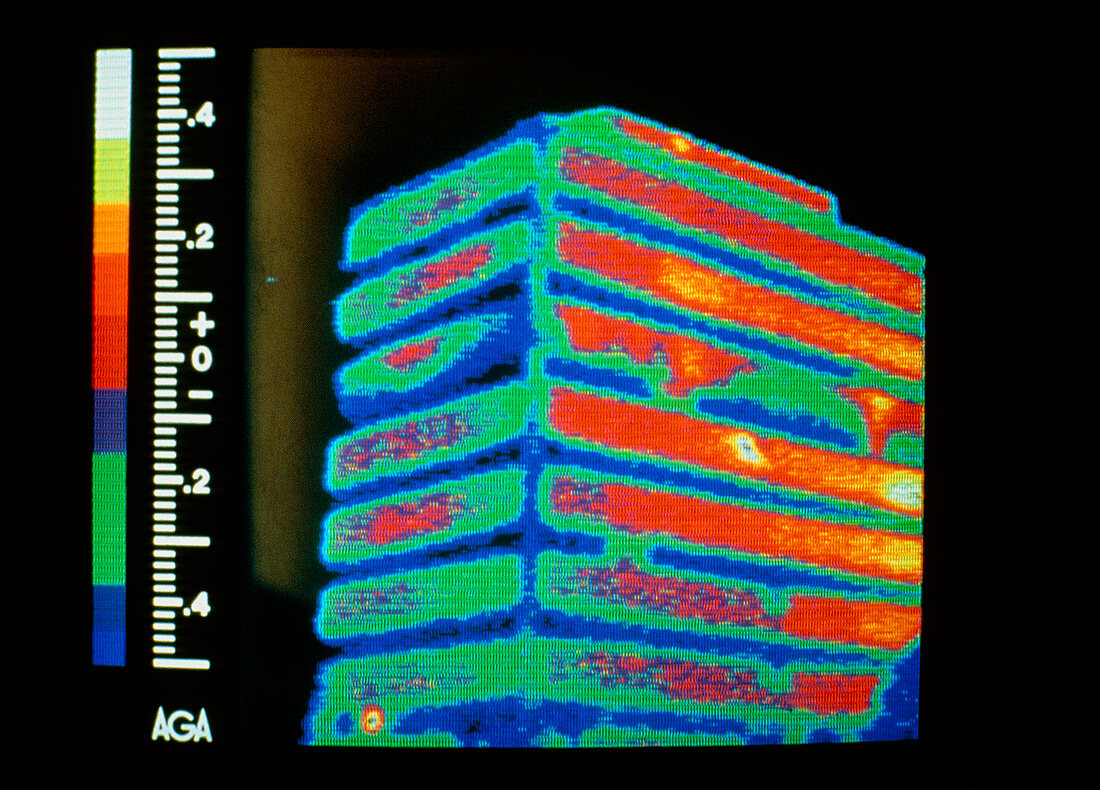
| Thermogram of a multi-storey office building,showing heat loss. The picture is colour-coded as shown by the colour bar at left,with white,yellow and red representing the hottest areas and blue the coldest. The image clearly shows heat loss from the windows,especially in the upper storeys. Thermography - the imaging of heat - is increasingly employed to detect wasteful energy use. Picture recorded in Milton Keynes | |
| Licence : | Droits gérés |
| Crédit: | Science Photo Library / Williams & Metcalf |
| Taille de l’image : | 4961 px × 3563 px |
| Model Release : | Non requis |
| Property Release : | Non requis |
| Restrictions : | - |
Prix pour cette image À partir de 45 €
Produit vendu
(Calendrier, Carte postale, Carte de vœux, Impression sur textile, Packaging etc)
À partir de 45 €
Usage commercial
(Affichage, Annonce presse, Annonce TV, Carte, Digital - hors rés. sociaux, Digital - rés. sociaux etc)
À partir de 45 €
Éditorial
(Digital, Journal, Livre, Livre pratique, Magazine, Télévision etc)
À partir de 60 €
Usage non-commercial
(Digital - hors rés. sociaux, Digital - rés. sociaux etc)
À partir de 120 €