Diagram of seismic instruments at Parkfield
Numéro d’image : 11740463
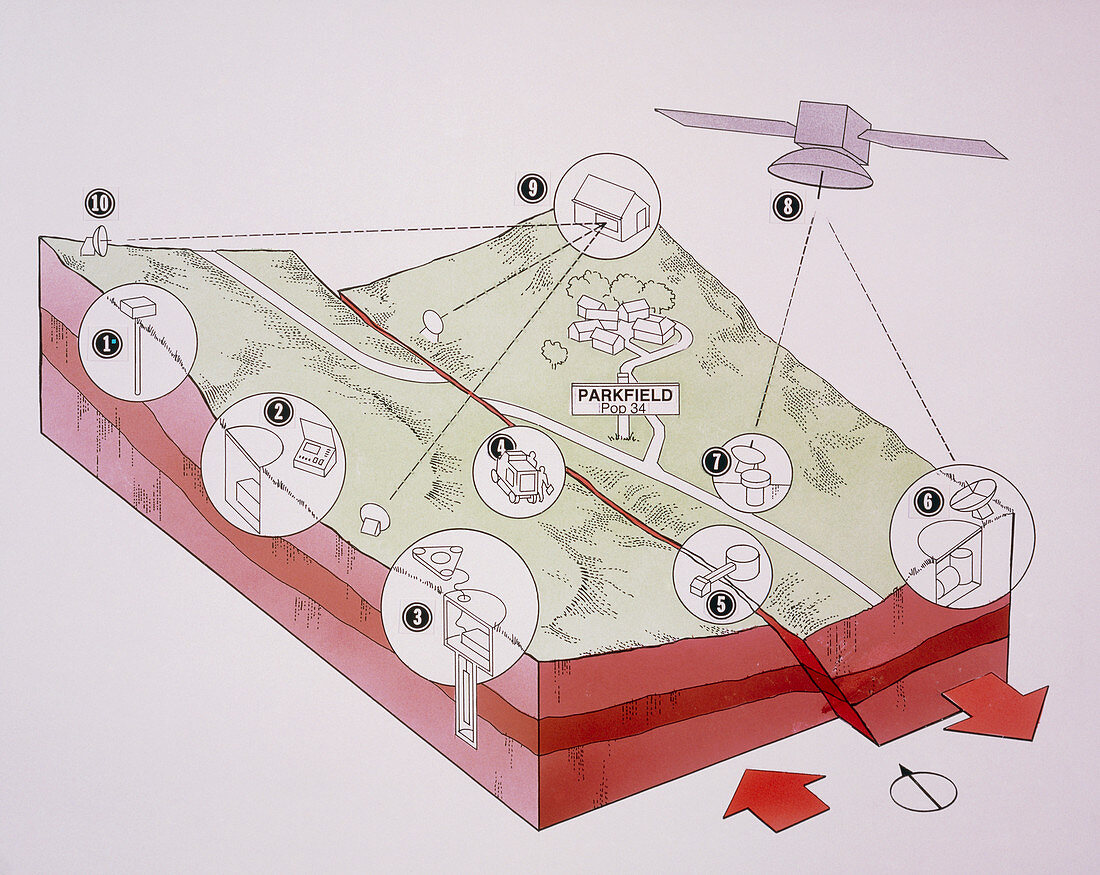
| Diagram of Parkfield earthquake prediction exper- iment,showing instrumentation: 1) seismometer in hole to record microquakes; 2) magnetometer to record magnetic field; 3) near-surface seismometer to record larger shocks; 4) VIBREOSIS truck that creates shear waves to probe the earthquake zone; 5) creepmeter to record surface movement; 6) strainmeter to monitor surface deformation; 7) sensors in water well to monitor groundwater level; 8) satellite relaying data to US Geological Survey; 9) laser to measure surface movement by bouncing beams on reflectors (10). Arrows show crustal plates movements along San Andreas fault | |
| Licence : | Droits gérés |
| Crédit: | Science Photo Library / Green, Phil |
| Taille de l’image : | 5040 px × 4007 px |
| Model Release : | Non requis |
| Property Release : | Non requis |
| Restrictions : | - |
Prix pour cette image À partir de 45 €
Produit vendu
(Calendrier, Carte postale, Carte de vœux, Impression sur textile, Packaging etc)
À partir de 45 €
Usage commercial
(Affichage, Annonce presse, Annonce TV, Carte, Digital - hors rés. sociaux, Digital - rés. sociaux etc)
À partir de 45 €
Éditorial
(Digital, Journal, Livre, Livre pratique, Magazine, Télévision etc)
À partir de 60 €
Usage non-commercial
(Digital - hors rés. sociaux, Digital - rés. sociaux etc)
À partir de 120 €