Earth graphics of sea height during El Nino,1997
Numéro d’image : 11739659
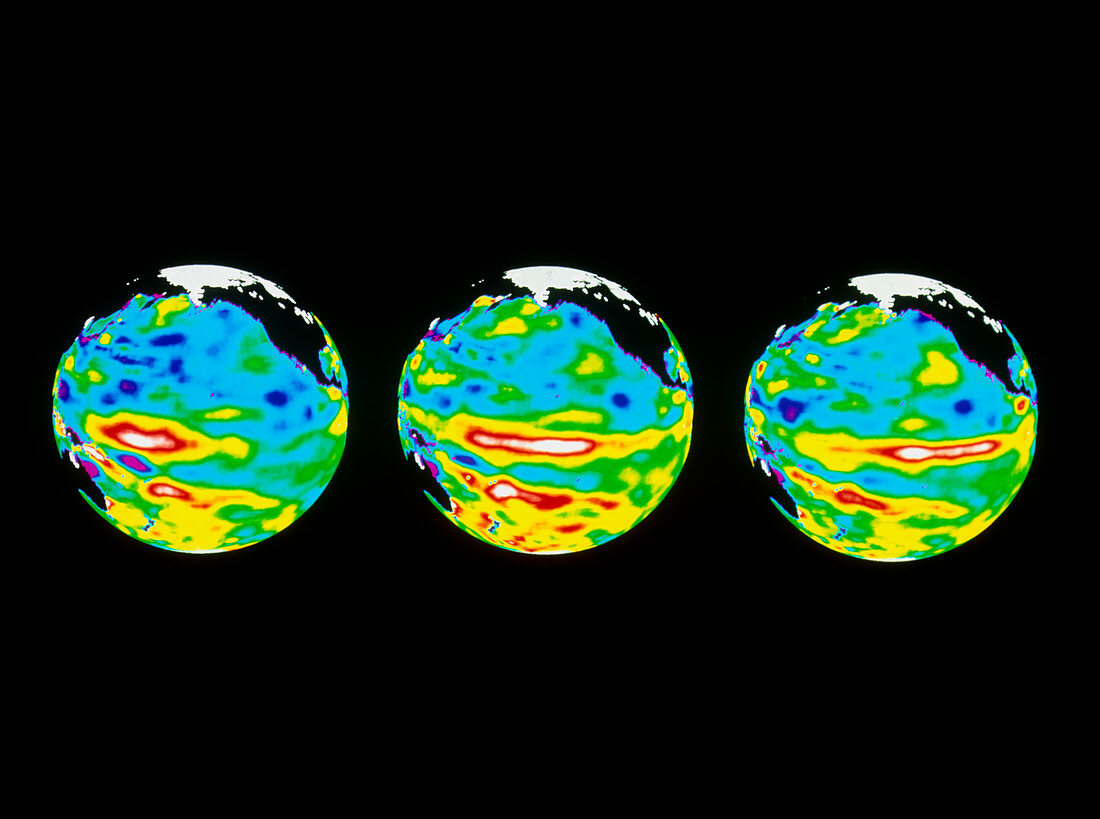
| 1997 El Nino. Three Earth graphics showing in time-lapse the 1997 El Nino event developing in the Pacific Ocean. The El Nino can affect global weather patterns. The difference between average sea heights and those caused by the warm water of the El Nino are shown as colours,from purple (10 centimetres (cm) below normal level) through blue,green,yellow,red to white (20cm above normal level). The El Nino is the white patch which is moving eastwards along the equator across the Pacific. The globes are dated (from left to right): 17 March,23 March and 6 April. These images were produced by combining data taken by the ADEOS and TOPEX/ Poseidon satellites | |
| Licence : | Droits gérés |
| Crédit: | Science Photo Library / NASA |
| Taille de l’image : | 4961 px × 3693 px |
| Model Release : | Non requis |
| Property Release : | Non requis |
| Restrictions : | - |
Prix pour cette image À partir de 45 €
Produit vendu
(Calendrier, Carte postale, Carte de vœux, Impression sur textile, Packaging etc)
À partir de 45 €
Usage commercial
(Affichage, Annonce presse, Annonce TV, Carte, Digital - hors rés. sociaux, Digital - rés. sociaux etc)
À partir de 45 €
Éditorial
(Digital, Journal, Livre, Livre pratique, Magazine, Télévision etc)
À partir de 60 €
Usage non-commercial
(Digital - hors rés. sociaux, Digital - rés. sociaux etc)
À partir de 120 €