Earth graphic showing sea height during an El Nino
Numéro d’image : 11739658
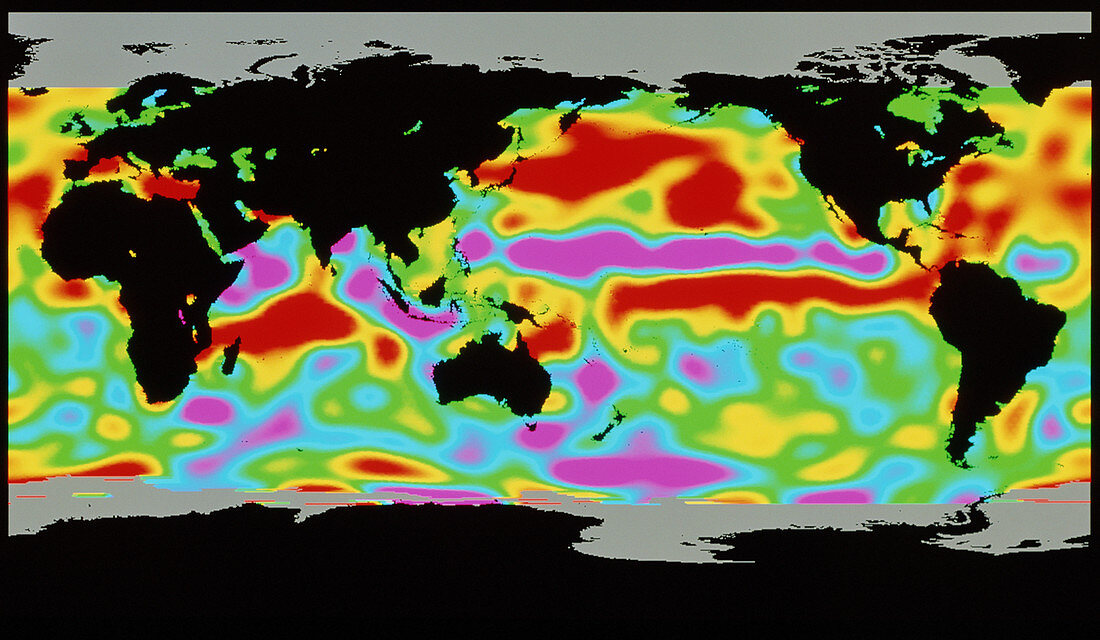
| El Nino event. Earth graphic showing the difference between average sea heights and those during an El Nino event in the Pacific Ocean (at centre right). Colours run from purple (10 cm below normal level) through blue,green (normal level) and yellow to red (10 cm above normal level). The El Nino is the red patch running across the Pacific at the equator. An El Nino is caused by weak westward trade winds which allow warm water to remain near South America. This mass of warm water affects global weather,causing drought in South East Asia & Australia and storms on the American continent. The image was taken by the TOPEX/Poseidon satellite in November | |
| Licence : | Droits gérés |
| Crédit: | Science Photo Library / NASA |
| Taille de l’image : | 4928 px × 2865 px |
| Model Release : | Non requis |
| Property Release : | Non requis |
| Restrictions : | - |
Prix pour cette image À partir de 45 €
Produit vendu
(Calendrier, Carte postale, Carte de vœux, Impression sur textile, Packaging etc)
À partir de 45 €
Usage commercial
(Affichage, Annonce presse, Annonce TV, Carte, Digital - hors rés. sociaux, Digital - rés. sociaux etc)
À partir de 45 €
Éditorial
(Digital, Journal, Livre, Livre pratique, Magazine, Télévision etc)
À partir de 60 €
Usage non-commercial
(Digital - hors rés. sociaux, Digital - rés. sociaux etc)
À partir de 120 €