Computer model of global ocean currents
Numéro d’image : 11739656
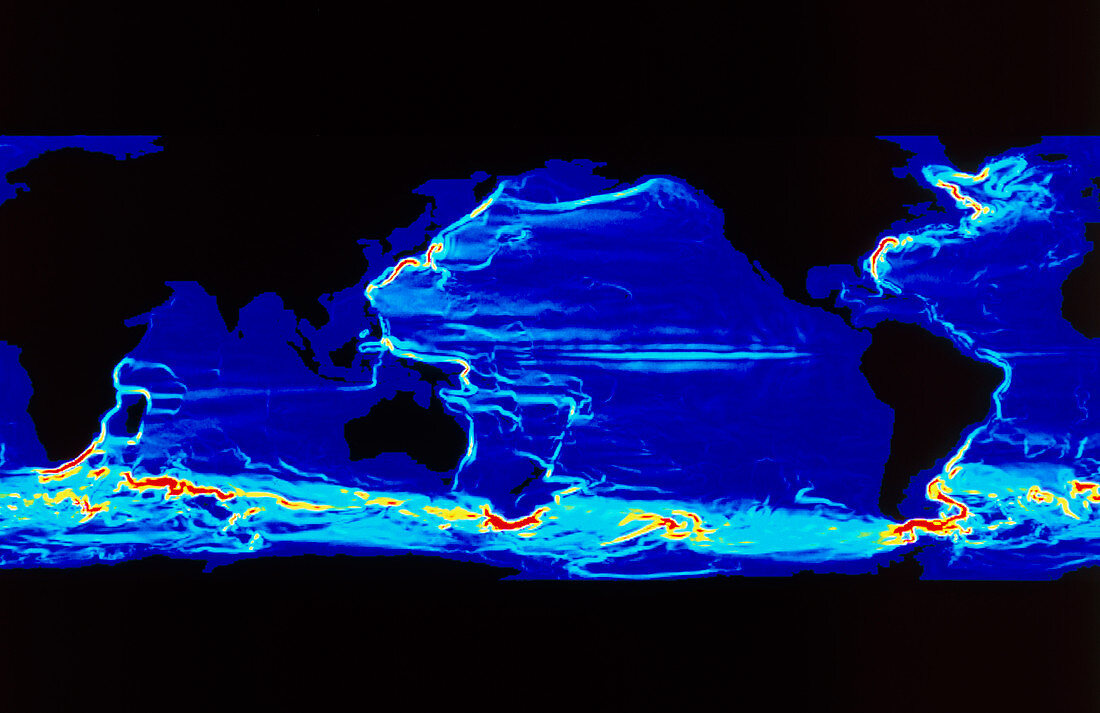
| Computer model of ocean currents. Velocity map of ocean waters,derived from a simulation of ocean dynamics for four years. The colours represent vertically integrated velocities,from red (fastest) to blue (slowest). The model has predicted many major currents,including the Agulhas (bottom left),Kiroshio (upper centre),Falkland (bottom right) and the Gulf Stream (top right). The wind-driven Antarctic Circumpolar Current runs across the bottom of the frame. The model used a spatial resolution of 0.5 degrees latitude and longitude with 20 depth levels. Wind,heat and salinity forcing were also included | |
| Licence : | Droits gérés |
| Crédit: | Science Photo Library / Los Alamos National Laboratory |
| Taille de l’image : | 5581 px × 3615 px |
| Model Release : | Non requis |
| Property Release : | Non requis |
| Restrictions : | - |
Prix pour cette image À partir de 45 €
Produit vendu
(Calendrier, Carte postale, Carte de vœux, Impression sur textile, Packaging etc)
À partir de 45 €
Usage commercial
(Affichage, Annonce presse, Annonce TV, Carte, Digital - hors rés. sociaux, Digital - rés. sociaux etc)
À partir de 45 €
Éditorial
(Digital, Journal, Livre, Livre pratique, Magazine, Télévision etc)
À partir de 60 €
Usage non-commercial
(Digital - hors rés. sociaux, Digital - rés. sociaux etc)
À partir de 120 €