Topography of the Earth's ocean surface
Numéro d’image : 11739622
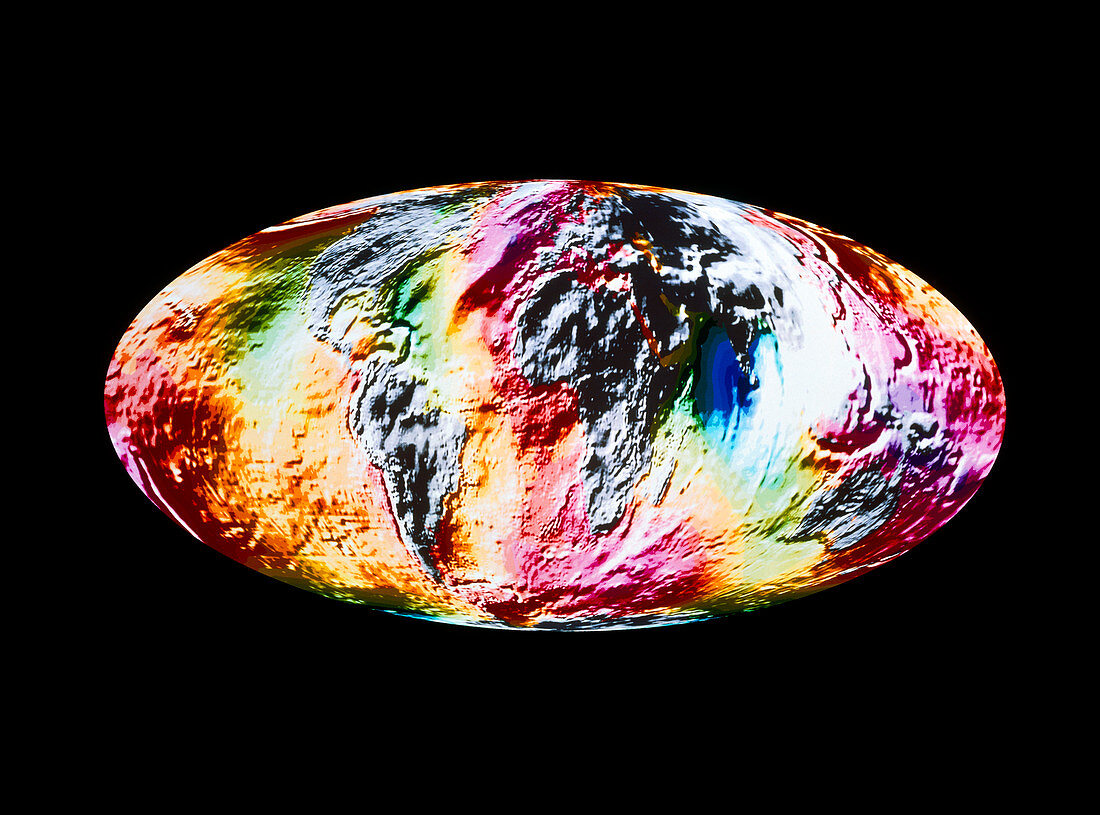
| Global ocean surface topography. Map of the Earth,showing the ocean surface topography. The colours depict deviation from the mean ocean surface caused by local differences in the Earth's gravit- ational field. The colours run from purple (up to 85 metres above mean) through red,orange,yellow and green,to blue (up to 105 metres below mean). Land masses are grey and the whole map is shown in shaded-relief to reveal features such as ocean floor ridges. Height deviations are measured from an artificial gravity surface,the geoid. The image was produced using altimetry data from the European ERS-1 and ERS-2 radar mapping satellites,in addition to land-based gravity measurements | |
| Licence : | Droits gérés |
| Crédit: | Science Photo Library / GFZ |
| Taille de l’image : | 4961 px × 3677 px |
| Model Release : | Non requis |
| Property Release : | Non requis |
| Restrictions : | - |
Prix pour cette image À partir de 45 €
Produit vendu
(Calendrier, Carte postale, Carte de vœux, Impression sur textile, Packaging etc)
À partir de 45 €
Usage commercial
(Affichage, Annonce presse, Annonce TV, Carte, Digital - hors rés. sociaux, Digital - rés. sociaux etc)
À partir de 45 €
Éditorial
(Digital, Journal, Livre, Livre pratique, Magazine, Télévision etc)
À partir de 60 €
Usage non-commercial
(Digital - hors rés. sociaux, Digital - rés. sociaux etc)
À partir de 120 €