Computer simulation of global sea surface temp
Numéro d’image : 11739612
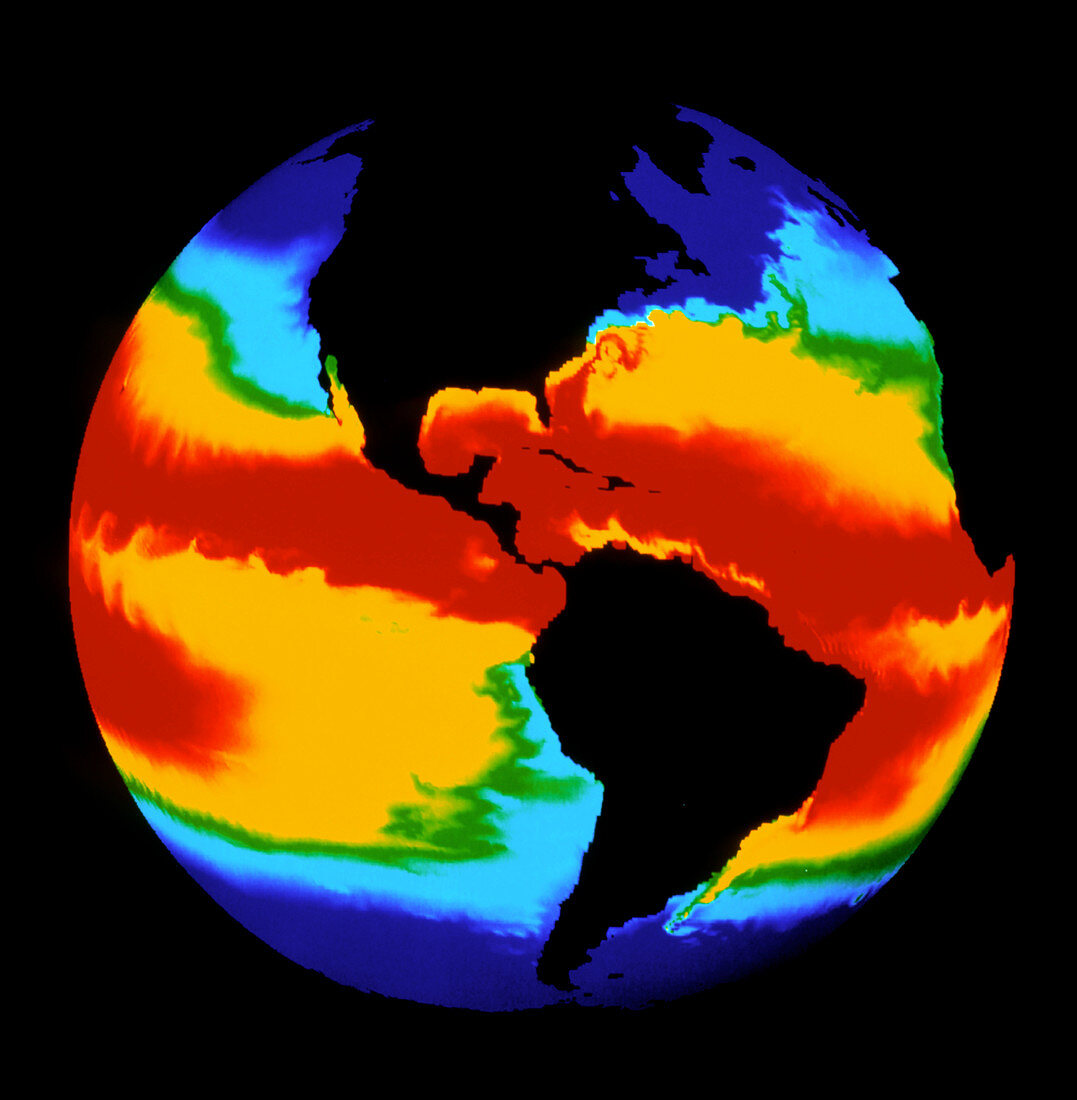
| Computer model of global sea surface temperature. Computed sea surface temperatures mapped onto a sphere. The temperatures are colour coded from red (warmest) through green and yellow to blue (coolest). The model has predicted several real- world phenomena,such as the Gulf Stream (upper right) and the Falkland current off South America (lower right). Large eddy streets are seen in equatorial latitudes,and large-scale waves are seen in the tropical Pacific. The model used a spatial resolution of 0.5 degrees of latitude and longitude and 20 vertical depth levels,combined with realistic ocean floor topography | |
| Licence : | Droits gérés |
| Crédit: | Science Photo Library / Los Alamos National Laboratory |
| Taille de l’image : | 2717 px × 2776 px |
| Model Release : | Non requis |
| Property Release : | Non requis |
| Restrictions : | - |
Prix pour cette image À partir de 45 €
Produit vendu
(Calendrier, Carte postale, Carte de vœux, Impression sur textile, Packaging etc)
À partir de 45 €
Usage commercial
(Affichage, Annonce presse, Annonce TV, Carte, Digital - hors rés. sociaux, Digital - rés. sociaux etc)
À partir de 45 €
Éditorial
(Digital, Journal, Livre, Livre pratique, Magazine, Télévision etc)
À partir de 60 €
Usage non-commercial
(Digital - hors rés. sociaux, Digital - rés. sociaux etc)
À partir de 120 €