Ozone hole 2000
Numéro d’image : 11736362
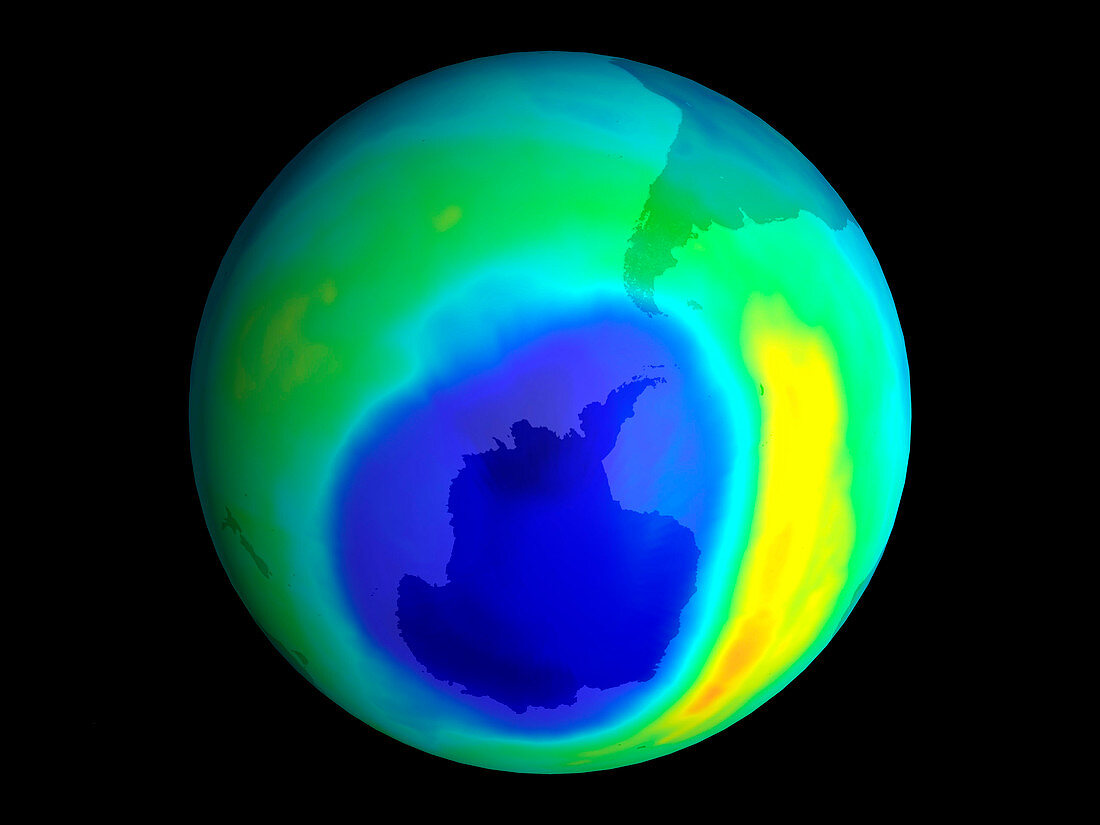
| Antarctic ozone depletion. Coloured satellite map of atmospheric ozone in the southern hemisphere on September 6,2000. The ozone hole (pale blue) over Antarctica (dark blue) is at its 2000 maximum of 11 million square miles. The ozone layer's thick- ness is measured in Dobson Units (DU) with 300 being an average figure. The map is colour-coded: yellow to orange (300-340 DU),green to blue (200- 280 DU) and dark blue (100-200 DU). The ozone hole is due to atmospheric pollution by halogen compou- nds from halons like CFCs (chlorofluorocarbons). It is greatest around October during the Antarctic spring. Data from the TOMS (Total Ozone Mapping Spectrometer) instrument on the TOMS-EP satellite | |
| Licence : | Droits gérés |
| Crédit: | Science Photo Library / NASA |
| Taille de l’image : | 2560 px × 1920 px |
| Model Release : | Non requis |
| Property Release : | Non requis |
| Restrictions : | - |
Prix pour cette image À partir de 45 €
Produit vendu
(Calendrier, Carte postale, Carte de vœux, Impression sur textile, Packaging etc)
À partir de 45 €
Usage commercial
(Affichage, Annonce presse, Annonce TV, Carte, Digital - hors rés. sociaux, Digital - rés. sociaux etc)
À partir de 45 €
Éditorial
(Digital, Journal, Livre, Livre pratique, Magazine, Télévision etc)
À partir de 60 €
Usage non-commercial
(Digital - hors rés. sociaux, Digital - rés. sociaux etc)
À partir de 120 €
Mots clés
- Antarctique,
- Antartica,
- atmosphère,
- atmospheric research,
- biosphère,
- dégradation de la couche d'ozone,
- destruction de la couche d'ozone,
- dommage,
- lumière ultraviolette,
- lumière UV,
- oxygène,
- problèmes environnementaux,
- science de la terre,
- sciences,
- stratosphère,
- terre,
- terrien,
- trou de la couche d'ozone