Total ozone map,south polar plot,6 October 1996
Numéro d’image : 11736350
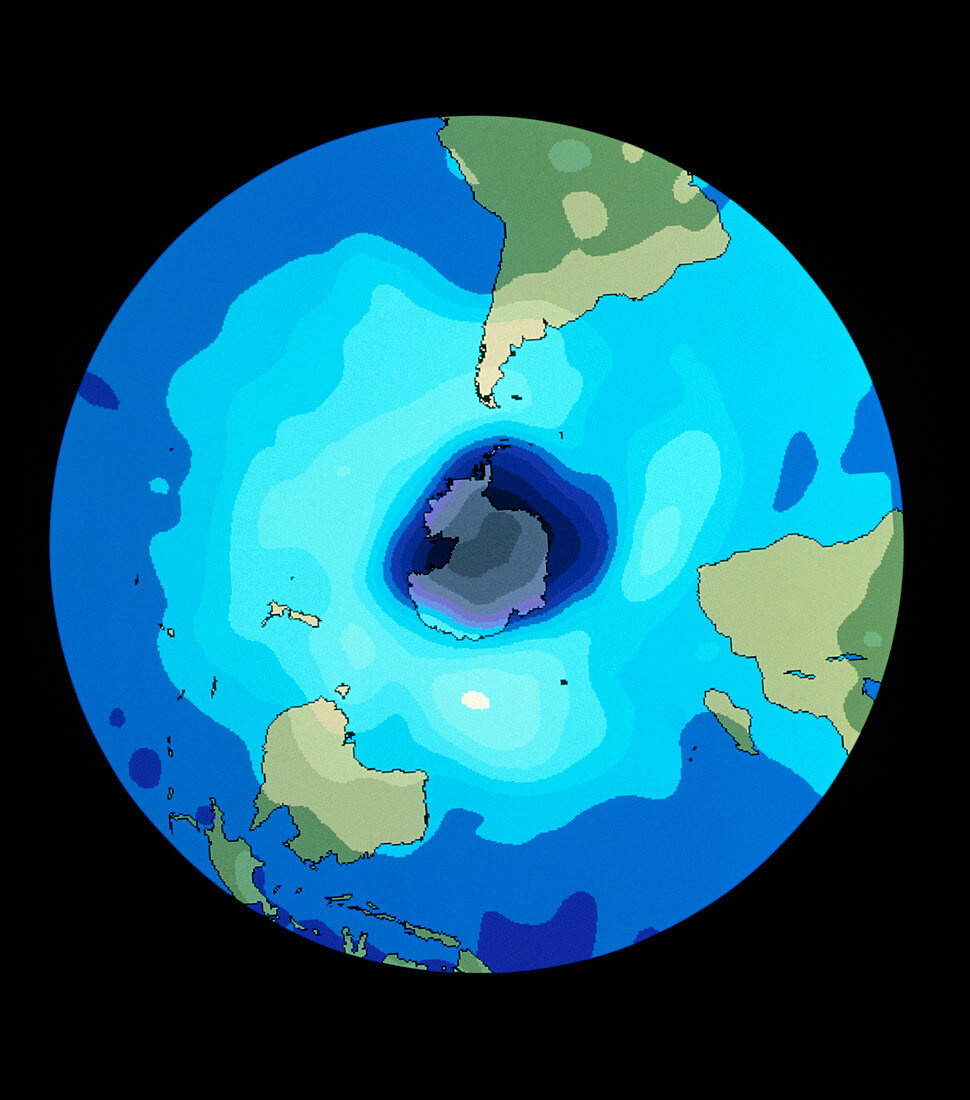
| Antarctic 'ozone hole' in 1996. Map of total atmospheric ozone concentration in the southern hemisphere on 6 October 1996. The colours represent the ozone concentration in Dobson Units (DU). The 'ozone hole' is at centre,coloured in mid blue (300-210 DU),dark blue (210-100 DU) and grey (less than 100 DU). Although smaller in area than in recent years,the ozone hole appears 'deeper' (ie more depleted). Normal 'healthy' values are around 280 DU. The data comes from the TIROS Ozone Vertical Sounder (TOVS) instrument on an American TIROS weather satellite | |
| Licence : | Droits gérés |
| Crédit: | Science Photo Library / NOAA |
| Taille de l’image : | 4165 px × 4724 px |
| Model Release : | Non requis |
| Property Release : | Non requis |
| Restrictions : |
|
Prix pour cette image À partir de 45 €
Produit vendu
(Calendrier, Carte postale, Carte de vœux, Impression sur textile, Packaging etc)
À partir de 45 €
Usage commercial
(Affichage, Annonce presse, Annonce TV, Carte, Digital - hors rés. sociaux, Digital - rés. sociaux etc)
À partir de 45 €
Éditorial
(Digital, Journal, Livre, Livre pratique, Magazine, Télévision etc)
À partir de 60 €
Usage non-commercial
(Digital - hors rés. sociaux, Digital - rés. sociaux etc)
À partir de 120 €