Total ozone map,south polar plot,6 October 1993
Numéro d’image : 11736336
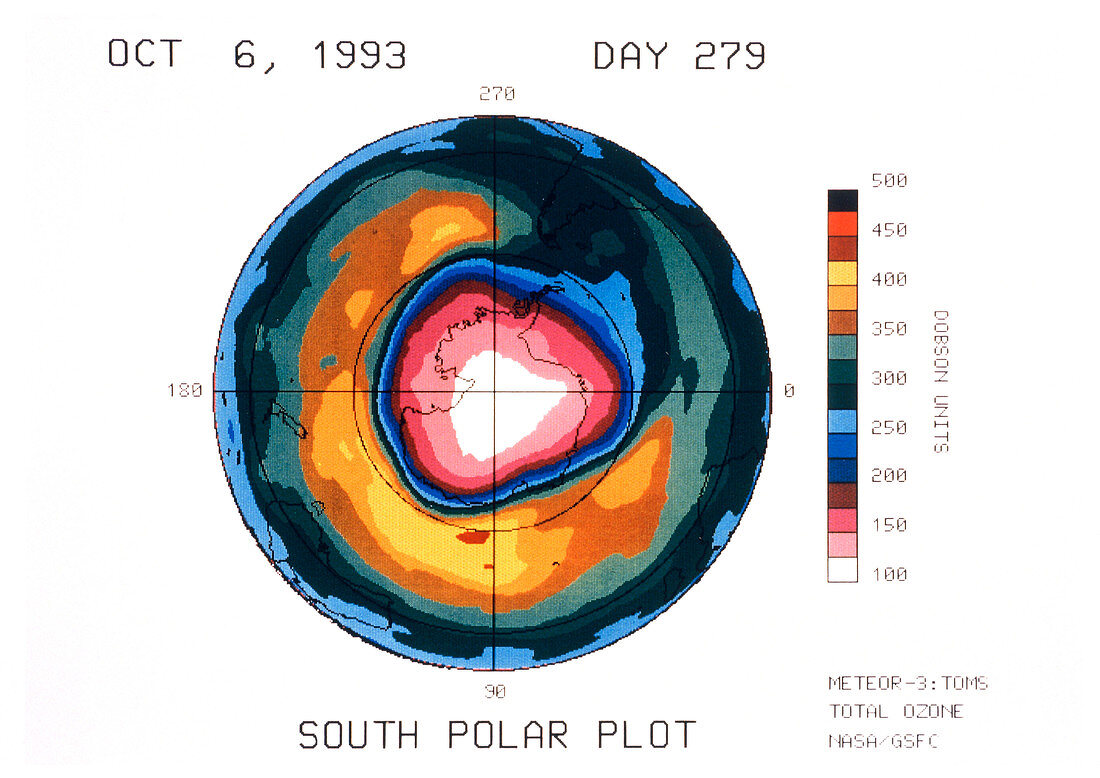
| Antarctic ozone depletion in 1993. Map of total atmospheric ozone concentration in the southern hemisphere on 6 October 1993. The colours represent the ozone concentration in Dobson Units (DU). The large,oval-shaped blue,pink and white area is the 'ozone hole' over the Antarctic,where ozone readings were below 250 DU. The depletion in 1993 was the worst to that date; the centre of the 'hole' recorded less than 100 DU,a decrease of at least 150 DU (60%) compared with pre-1975 values. The map shows Antarctica and other land areas outlined in black. The data were gathered by the Total Ozone Mapping Spectrometer (TOMS) instrument on the Russian Meteor-3 satellite | |
| Licence : | Droits gérés |
| Crédit: | Science Photo Library / NASA |
| Taille de l’image : | 5012 px × 3543 px |
| Model Release : | Non requis |
| Property Release : | Non requis |
| Restrictions : | - |
Prix pour cette image À partir de 45 €
Produit vendu
(Calendrier, Carte postale, Carte de vœux, Impression sur textile, Packaging etc)
À partir de 45 €
Usage commercial
(Affichage, Annonce presse, Annonce TV, Carte, Digital - hors rés. sociaux, Digital - rés. sociaux etc)
À partir de 45 €
Éditorial
(Digital, Journal, Livre, Livre pratique, Magazine, Télévision etc)
À partir de 60 €
Usage non-commercial
(Digital - hors rés. sociaux, Digital - rés. sociaux etc)
À partir de 120 €