Total ozone map,south polar plot,28 Sept. 1992
Numéro d’image : 11736333
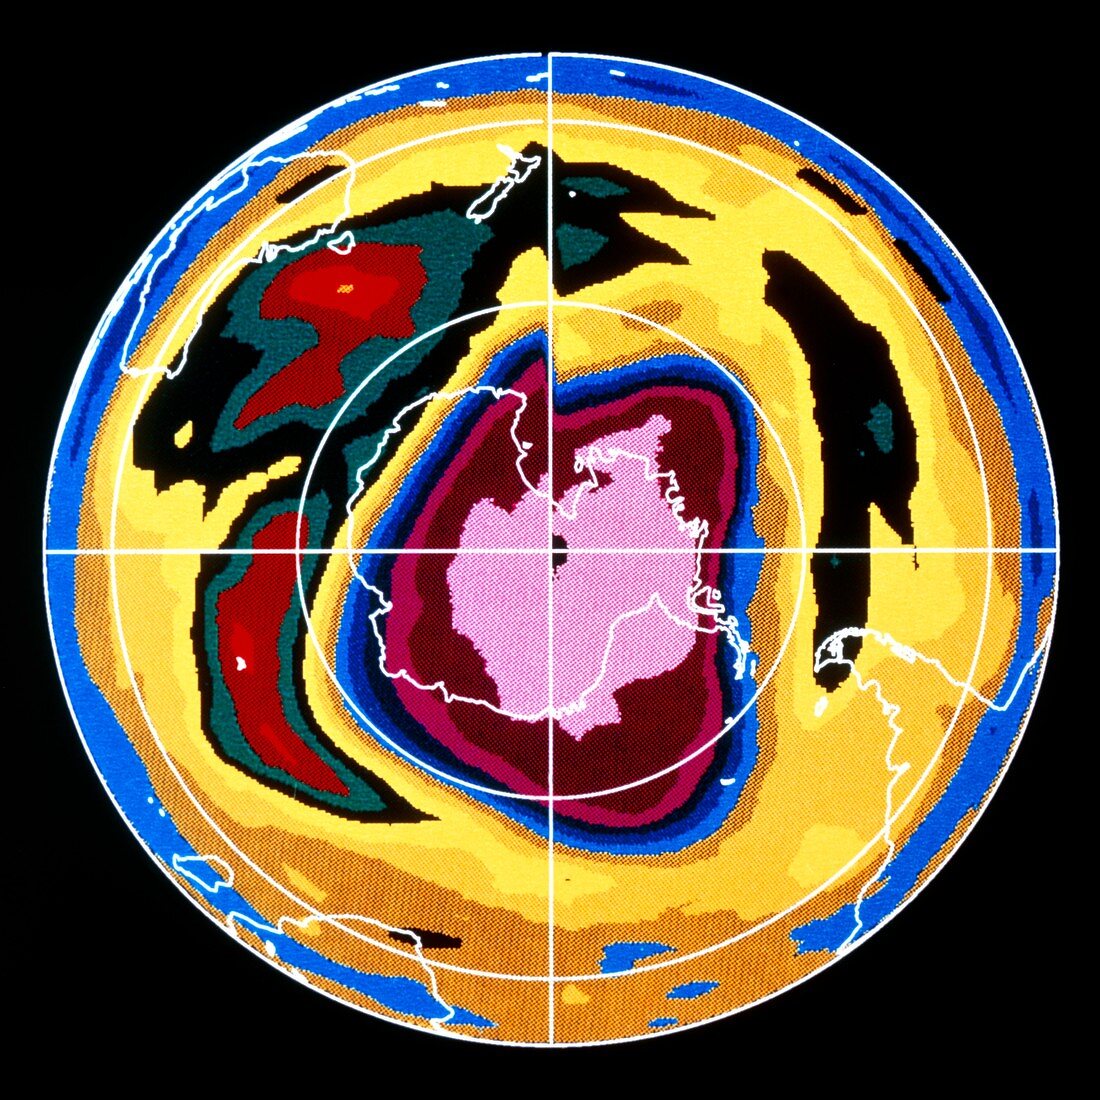
| Antarctic ozone depletion in 1992. Map of total atmospheric ozone concentration in the southern hemisphere on 28 September 1992. The colours represent the ozone concentration in Dobson Units (DU). The large,oval-shaped mauve and pink area is the 'ozone hole' over the Antarctic,where ozone readings were below 200 DU. Although the level of depletion was not as bad as 1991,the extent of the 'hole' was about 15% greater,by mid-October reaching the tip of South America (right). The oval shape is due to a large storm system (red/brown,upper left). The data were gathered by the Total Ozone Mapping Spectrometer (TOMS) instrument on the Nimbus-7 satellite | |
| Licence : | Droits gérés |
| Crédit: | Science Photo Library / NASA |
| Taille de l’image : | 4228 px × 4228 px |
| Model Release : | Non requis |
| Property Release : | Non requis |
| Restrictions : | - |
Prix pour cette image À partir de 45 €
Produit vendu
(Calendrier, Carte postale, Carte de vœux, Impression sur textile, Packaging etc)
À partir de 45 €
Usage commercial
(Affichage, Annonce presse, Annonce TV, Carte, Digital - hors rés. sociaux, Digital - rés. sociaux etc)
À partir de 45 €
Éditorial
(Digital, Journal, Livre, Livre pratique, Magazine, Télévision etc)
À partir de 60 €
Usage non-commercial
(Digital - hors rés. sociaux, Digital - rés. sociaux etc)
À partir de 120 €