Global aerosol distribution before+after Pinatubo
Numéro d’image : 11736328
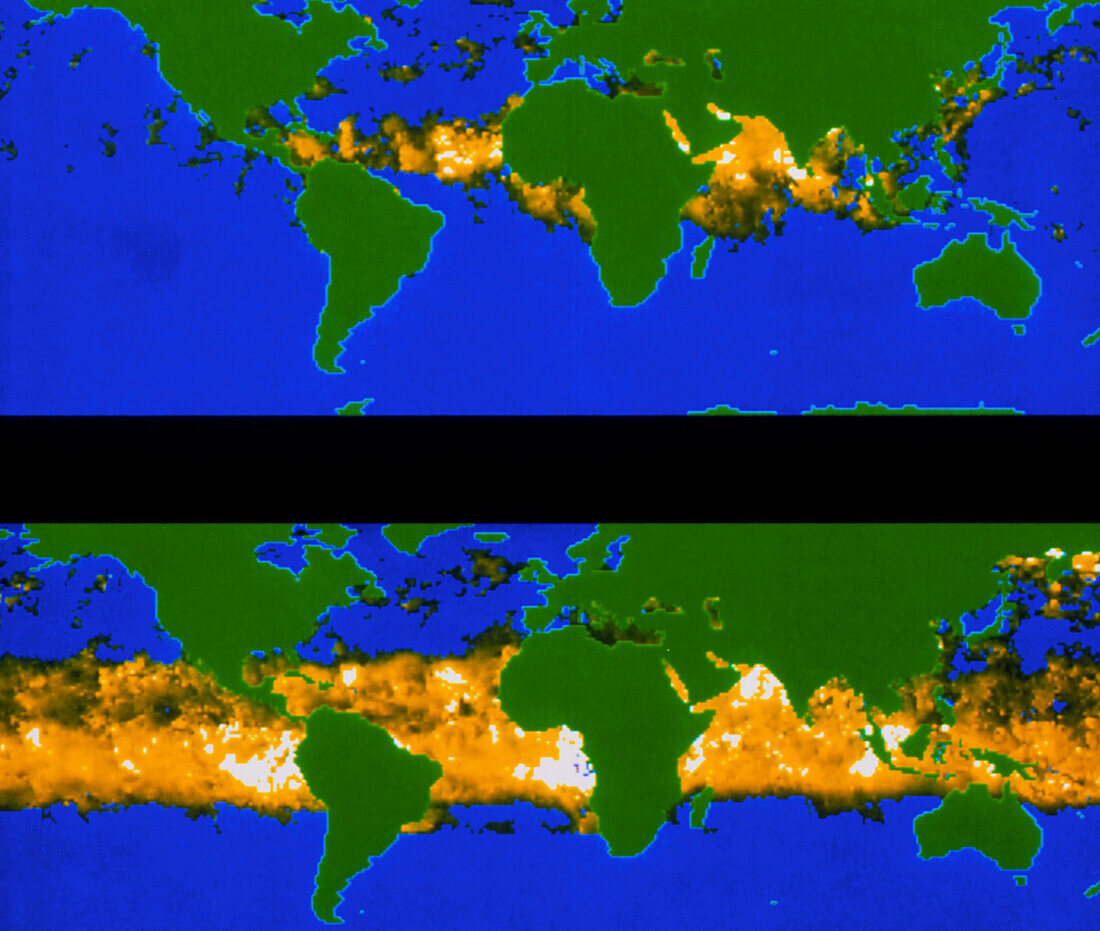
| Global effect of Mt Pinatubo's eruption. Two false-coloured maps of the world,showing the distribution of volcanic aerosols in the atmosphere,immediately after the eruption of Mt Pinatubo (top) and two months later (bottom). Aerosol concentration is shown as shades of yellow,from brown (lowest) to white (highest). Mt Pinatubo,in the Philippines,erupted on 16 June 1991. The top image (19-27 June) shows a near- normal aerosol distribution,with only a slight increase over the Indian Ocean. The bottom image (8-14 August) shows a vast aerosol plume around the equator. The data for these images were gathered by the polar-orbiting NOAA-11 satellite | |
| Licence : | Droits gérés |
| Crédit: | Science Photo Library / Carey, Robert M. / NOAA |
| Taille de l’image : | 3543 px × 2998 px |
| Model Release : | Non requis |
| Property Release : | Non requis |
| Restrictions : |
|
Prix pour cette image À partir de 45 €
Produit vendu
(Calendrier, Carte postale, Carte de vœux, Impression sur textile, Packaging etc)
À partir de 45 €
Usage commercial
(Affichage, Annonce presse, Annonce TV, Carte, Digital - hors rés. sociaux, Digital - rés. sociaux etc)
À partir de 45 €
Éditorial
(Digital, Journal, Livre, Livre pratique, Magazine, Télévision etc)
À partir de 60 €
Usage non-commercial
(Digital - hors rés. sociaux, Digital - rés. sociaux etc)
À partir de 120 €