3D model of temperature & moisture,climate model
Numéro d’image : 11736326
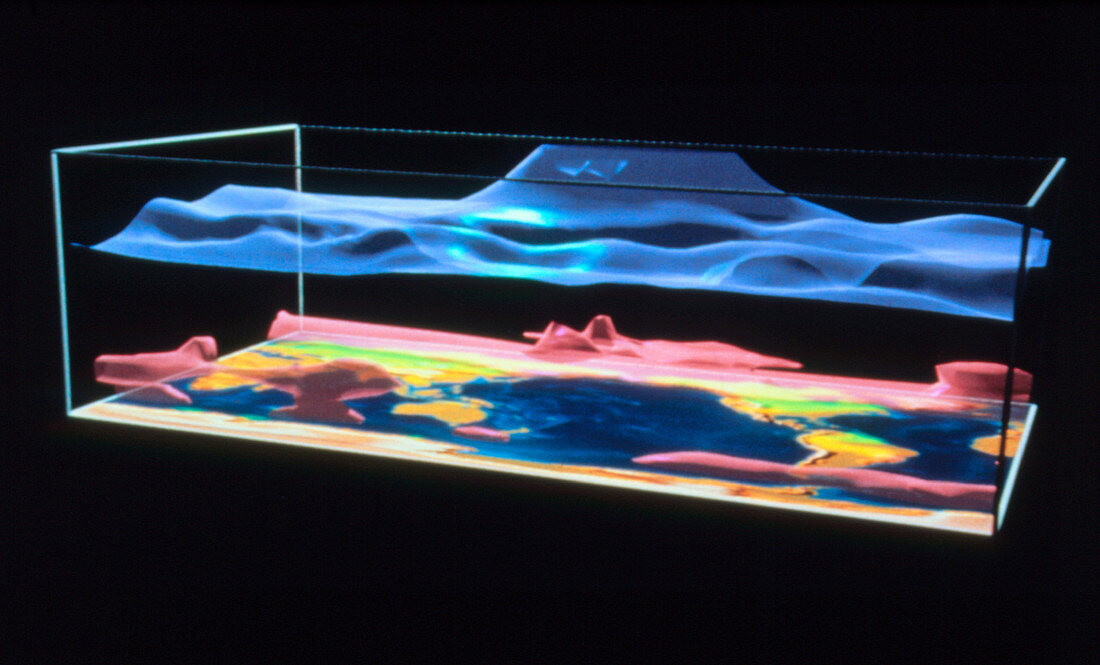
| Computer-generated 3-dimensional model of temperature and soil moisture differences due to global warming. The blue band at the top indicates the stratospheric levels where the air has cooled by more than 2 Celsius,the red lower band shows regions where low-level air has warmed by more than 5 Celsius. The green patches on the surface show increased soil moisture (more than 1cm increase in rain per 3 month period),the smaller bright yellow patches show decreased soil moisture (more than 1cm decrease). This model is the mean of values calculated for December-February,15-19 years into the model. The model assumes twice the current levels of atmospheric carbon dioxide | |
| Licence : | Droits gérés |
| Crédit: | Science Photo Library / UNIVERSITY CORPORATION FOR ATMOSPHERIC RESEARCH |
| Taille de l’image : | 3715 px × 2245 px |
| Model Release : | Non requis |
| Property Release : | Non requis |
| Restrictions : | - |
Prix pour cette image À partir de 45 €
Produit vendu
(Calendrier, Carte postale, Carte de vœux, Impression sur textile, Packaging etc)
À partir de 45 €
Usage commercial
(Affichage, Annonce presse, Annonce TV, Carte, Digital - hors rés. sociaux, Digital - rés. sociaux etc)
À partir de 45 €
Éditorial
(Digital, Journal, Livre, Livre pratique, Magazine, Télévision etc)
À partir de 60 €
Usage non-commercial
(Digital - hors rés. sociaux, Digital - rés. sociaux etc)
À partir de 120 €