Satellite map of ozone levels,northern hemisphere
Numéro d’image : 11736291
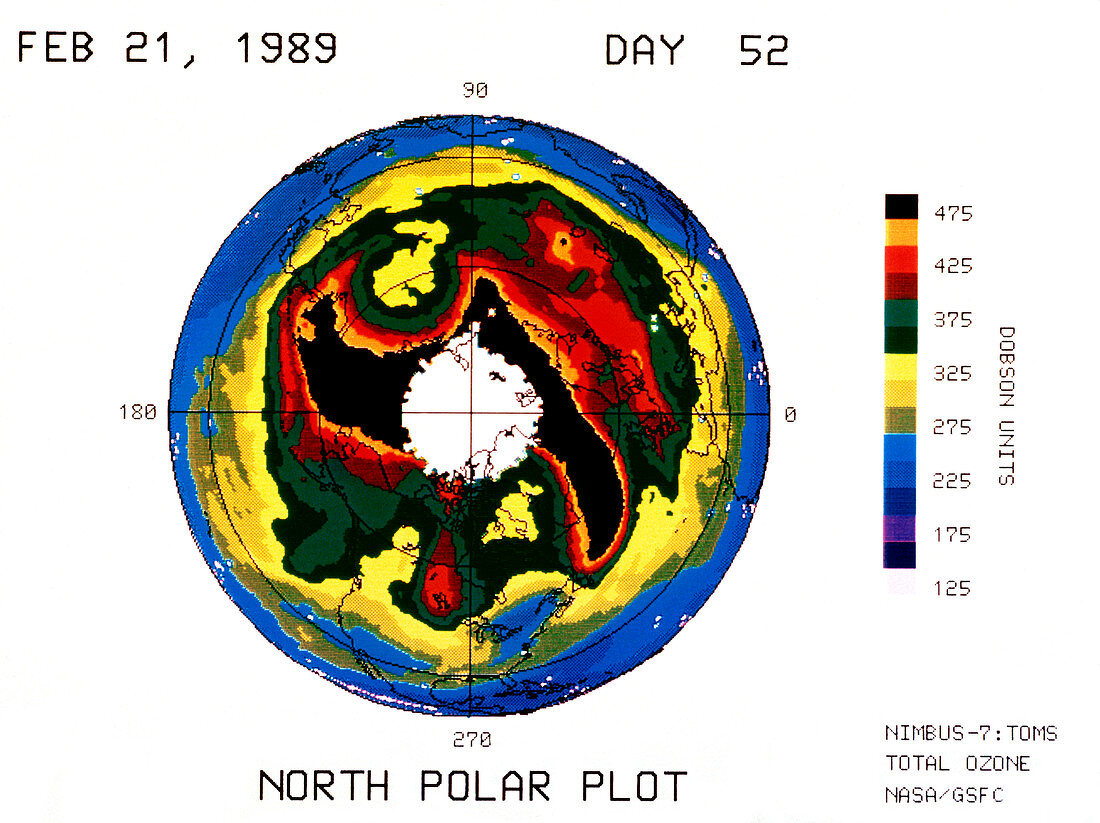
| Satellite map showing ozone levels over the Northern Hemisphere on February 21st,1989. The colours represent Dobson Units,a measure of atmospheric ozone. Two areas of low ozone concentration appear in yellow. The smaller region (at 5 o'clock) is located near Baffin Island,Canada and the other,slightly larger feature (at 11 o'clock) is over Siberia. These areas correspond to two lobes of the once stable polar air vortex that became elongated & split. The white area represents polar night,where measure- ments are not possible. Ozone depletion is caused by atmospheric pollution by chloro-fluorocarbons (CFCs) used in aerosols & refrigerants | |
| Licence : | Droits gérés |
| Crédit: | Science Photo Library / NASA |
| Taille de l’image : | 4961 px × 3712 px |
| Model Release : | Non requis |
| Property Release : | Non requis |
| Restrictions : | - |
Prix pour cette image À partir de 45 €
Produit vendu
(Calendrier, Carte postale, Carte de vœux, Impression sur textile, Packaging etc)
À partir de 45 €
Usage commercial
(Affichage, Annonce presse, Annonce TV, Carte, Digital - hors rés. sociaux, Digital - rés. sociaux etc)
À partir de 45 €
Éditorial
(Digital, Journal, Livre, Livre pratique, Magazine, Télévision etc)
À partir de 60 €
Usage non-commercial
(Digital - hors rés. sociaux, Digital - rés. sociaux etc)
À partir de 120 €