'Breathing Earth' CO2 input/output,global map
Numéro d’image : 11735581
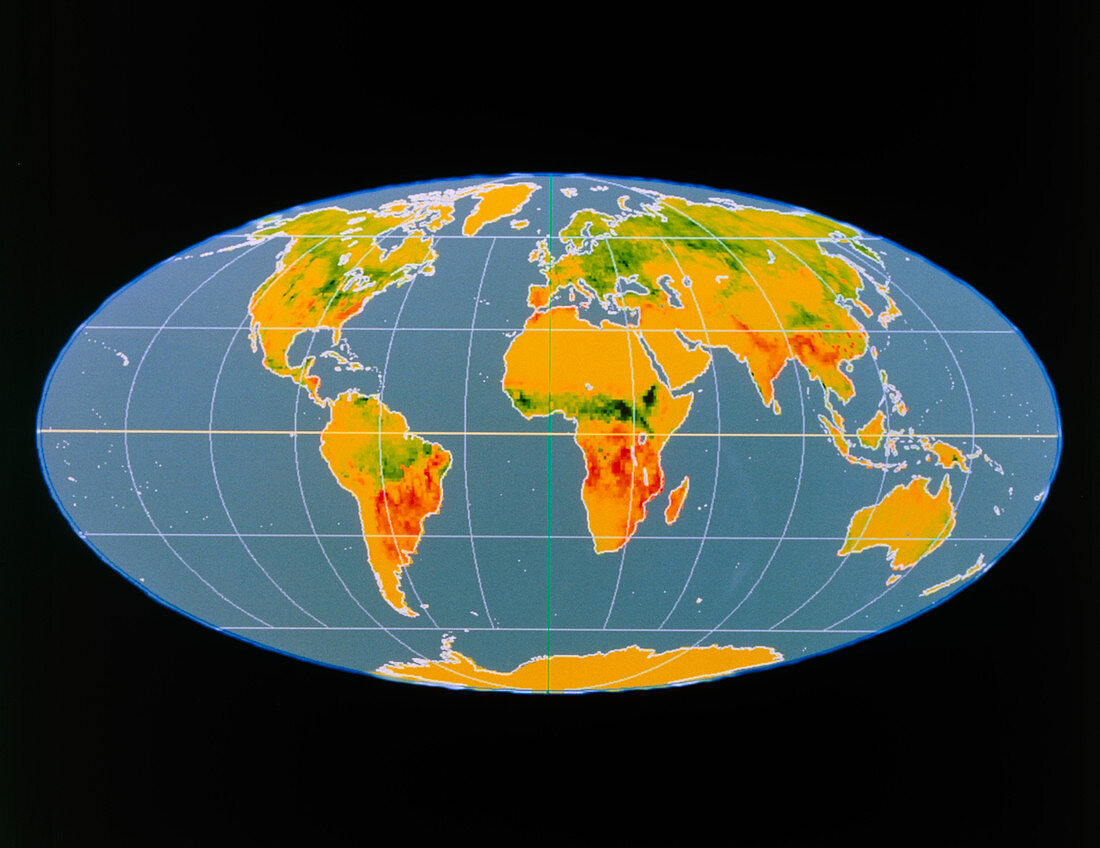
| The 'Breathing Earth'. Map showing the global distribution of release and absorption of carbon dioxide by the Earth's biosphere for a typical June. The map is a result of a complex computer model of biological processes across the world. The colours represent the flow of carbon dioxide in units of grammes per square metre per month: from red (120 g/sq.m released) through yellow (no net flow) to green (100 g/sq.m absorbed). Note the high activity of plants in the Northern Hemisphere fixing the gas from the air (green),and the large areas of gas release resulting from microbial plant decomposition in the Southern Hemisphere and south Asia (orange and red) | |
| Licence : | Droits gérés |
| Crédit: | Science Photo Library / NASA |
| Taille de l’image : | 4944 px × 3811 px |
| Model Release : | Non requis |
| Property Release : | Non requis |
| Restrictions : | - |
Prix pour cette image À partir de 45 €
Produit vendu
(Calendrier, Carte postale, Carte de vœux, Impression sur textile, Packaging etc)
À partir de 45 €
Usage commercial
(Affichage, Annonce presse, Annonce TV, Carte, Digital - hors rés. sociaux, Digital - rés. sociaux etc)
À partir de 45 €
Éditorial
(Digital, Journal, Livre, Livre pratique, Magazine, Télévision etc)
À partir de 60 €
Usage non-commercial
(Digital - hors rés. sociaux, Digital - rés. sociaux etc)
À partir de 120 €