Map of CO2 emission from fossil fuel combustion
Numéro d’image : 11735576
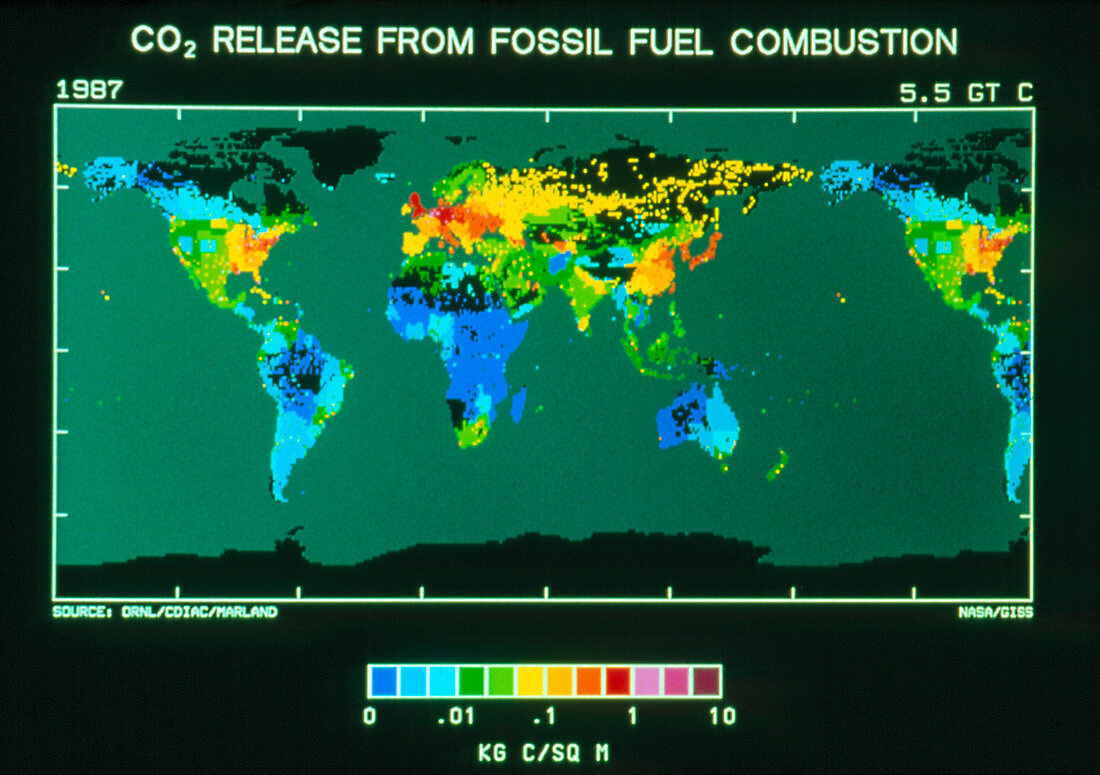
| Computer-generated map of the world showing the distribution of carbon dioxide released from the combustion of fossil fuels. The map was created using country statistics of natural gas,crude oil & coal consumption for 1987. Estimates of carbon dioxide emissions were then distributed geograph- ically based on the human population (this assumes that energy is distributed on a per capita basis). The scale is measured in kilogrammes of carbon per square metre per year. Black areas indicate an absence of data. Levels of carbon dioxide,the most abundant & important of the greenhouse gases,are generally taken as an index of global warming | |
| Licence : | Droits gérés |
| Crédit: | Science Photo Library / NASA, GODDARD INSTITUTE FOR SPACE STUDIES |
| Taille de l’image : | 3444 px × 2425 px |
| Model Release : | Non requis |
| Property Release : | Non requis |
| Restrictions : | - |
Prix pour cette image À partir de 45 €
Produit vendu
(Calendrier, Carte postale, Carte de vœux, Impression sur textile, Packaging etc)
À partir de 45 €
Usage commercial
(Affichage, Annonce presse, Annonce TV, Carte, Digital - hors rés. sociaux, Digital - rés. sociaux etc)
À partir de 45 €
Éditorial
(Digital, Journal, Livre, Livre pratique, Magazine, Télévision etc)
À partir de 60 €
Usage non-commercial
(Digital - hors rés. sociaux, Digital - rés. sociaux etc)
À partir de 120 €