Map showing changes to the Earth's tree cover
Numéro d’image : 13470770
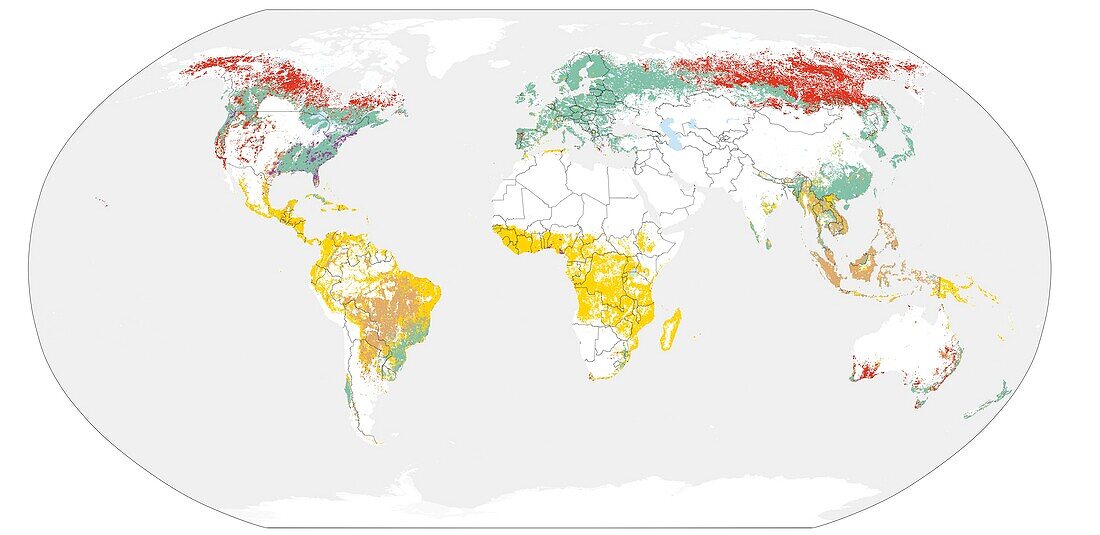
| Map showing the dominant causes of change to the Earth's tree cover from 2001-2020. Yellow areas show places that have had clearing of trees for small farming plots. Tan areas of the map show areas where forest have been cleared for the growth of commodity crops. Red areas show places where forests have been lost due to wildfires. Green areas show places with changes due to forestry. Purple areas show areas that have had changes in tree cover due to urbanization. Data obtained using the Landsat satellites. | |
| Licence : | Droits gérés |
| Crédit: | Science Photo Library / World Resources Institute / The Sustainability Consortium / University of Maryland / NASA |
| Taille de l’image : | 4500 px × 2188 px |
| Model Release : | Non requis |
| Property Release : | Non requis |
| Restrictions : | - |
Prix pour cette image À partir de 45 €
Produit vendu
(Calendrier, Carte postale, Carte de vœux, Impression sur textile, Packaging etc)
À partir de 45 €
Usage commercial
(Affichage, Annonce presse, Annonce TV, Carte, Digital - hors rés. sociaux, Digital - rés. sociaux etc)
À partir de 45 €
Éditorial
(Digital, Journal, Livre, Livre pratique, Magazine, Télévision etc)
À partir de 60 €
Usage non-commercial
(Digital - hors rés. sociaux, Digital - rés. sociaux etc)
À partir de 120 €
Mots clés
- 21ème siècle,
- agricole,
- agriculture,
- arrière plan blanc,
- arrière-plan blanc,
- aucun,
- carte,
- changement climatique,
- data,
- décès,
- déforestation,
- donnée,
- feu de forêt,
- fond blanc,
- forestière,
- géographie,
- géographique,
- huiles,
- landsat 8,
- landsat huit,
- LDCM,
- modèle,
- modélisation,
- modéliser,
- personne,
- perte,
- réchauffement climatique,
- satellite,
- sylviculture,
- urbanisation,
- XX1ème siècle