Normal T wave morphology, illustration
Numéro d’image : 13453432
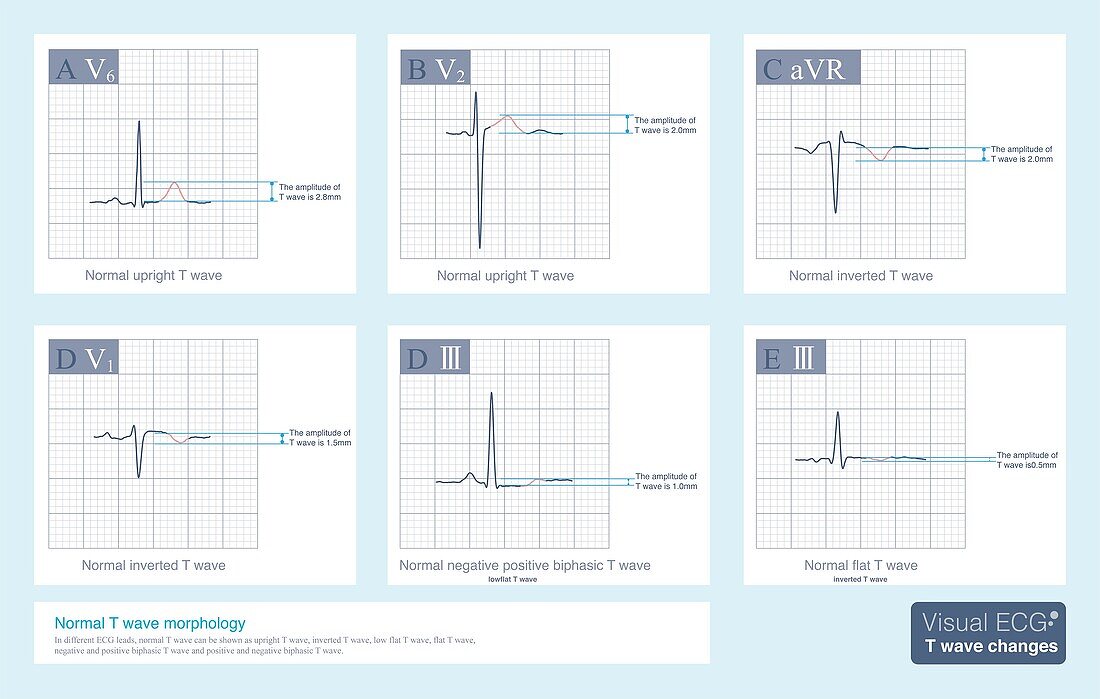
| Electrocardiogram (ECG) illustration showing normal T wave morphology. In different ECG leads a normal T wave can be shown as an upright T wave, inverted T wave, low flat T wave, flat T wave, negative and positive biphasic T wave, or positive and negative biphasic T wave. When learning ECG, we should fully understand the normal T wave shape of each ECG lead. | |
| Licence : | Droits gérés |
| Crédit: | Science Photo Library / CHONGQING TUMI TECHNOLOGY LTD |
| Taille de l’image : | 4600 px × 2922 px |
| Model Release : | Non requis |
| Property Release : | Non requis |
| Restrictions : | - |
Prix pour cette image À partir de 45 €
Produit vendu
(Calendrier, Carte postale, Carte de vœux, Impression sur textile, Packaging etc)
À partir de 45 €
Usage commercial
(Affichage, Annonce presse, Annonce TV, Carte, Digital - hors rés. sociaux, Digital - rés. sociaux etc)
À partir de 45 €
Éditorial
(Digital, Journal, Livre, Livre pratique, Magazine, Télévision etc)
À partir de 60 €
Usage non-commercial
(Digital - hors rés. sociaux, Digital - rés. sociaux etc)
À partir de 120 €