SOHO image of solar (Sun) rotation rate with depth
Numéro d’image : 11884060
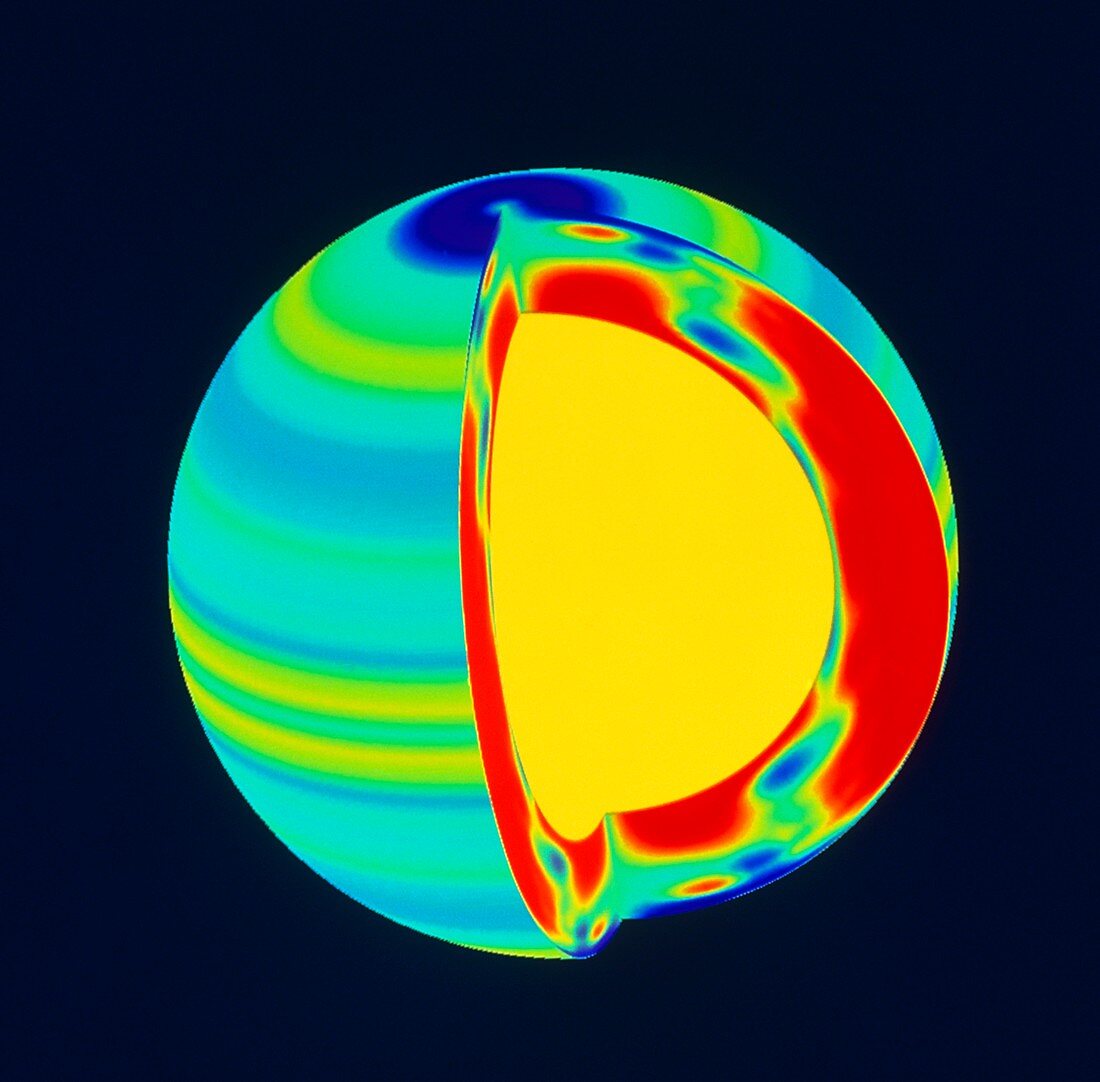
| Solar rotation. Cutaway artwork of the Sun,showing the difference in speeds between different areas of the Sun,based on data from the Solar Heliospheric Observatory (SOHO) satellite. The image is colour-coded to represent rotation speed,with red and yellow being faster than average,green areas average and blue areas slower than average. Zones of hot,electrically-charged gas (plasma) travelling at different speeds give the sun's surface a banded appearance. Sunspots tend to appear at the edge of these bands,possibly because the plasma speed variations in these zones disrupts the local magnetic field. Data taken by SOHO's Michelson Doppler Imager (MDI) instrument | |
| Licence : | Droits gérés |
| Crédit: | Science Photo Library / NASA |
| Taille de l’image : | 4252 px × 4181 px |
| Model Release : | Non requis |
| Property Release : | Non requis |
| Restrictions : | - |
Prix pour cette image À partir de 45 €
Produit vendu
(Calendrier, Carte postale, Carte de vœux, Impression sur textile, Packaging etc)
À partir de 45 €
Usage commercial
(Affichage, Annonce presse, Annonce TV, Carte, Digital - hors rés. sociaux, Digital - rés. sociaux etc)
À partir de 45 €
Éditorial
(Digital, Journal, Livre, Livre pratique, Magazine, Télévision etc)
À partir de 60 €
Usage non-commercial
(Digital - hors rés. sociaux, Digital - rés. sociaux etc)
À partir de 120 €